
Aid, Debt and Sovereignty
A short public study and a book guide on how aid, debt, trade, infrastructure and institutions change the real scope of political choice.
RECENSIVE INTRODUCTION AND DISTINCT PUBLIC STUDY
What this publication examines
Aid, Debt and Sovereignty asks for a seemingly simple thing: when economic aid is real aid and when it becomes a tool of long-term influence. The answer is not sought in a single indicator or in a preselected ideological story. It shall monitor the money, goods, production capacity, infrastructure, trade links, monetary arrangements and the space left to the beneficiary for changing its own policy. The reader thus receives not the ranking of "good" and "bad" powers, but the instruction on how to compare different relationships with the same measure.
The book progresses from Lend- Lase and Marshall's plan to reparations, the Soviet economic sphere and the RVHP to the collapse of the rubble zone, the transformation crises after 1989, and the different routes of the post-Soviet republics. The following are case studies of Russia, Central Europe, the Baltic States, Central Asia, Ukraine, the South Caucasus, Denmark and Iceland. The conclusion links historical data to a more general issue of economic sovereignty: it is not only about the size of debt, but also about the concentration of creditors, the substitutability of suppliers, the control of infrastructure and the ability to reject conditions without economic collapse.

What a reader can expect
The text is a large comparative study, not a rapid controversy. Its strong point is to distinguish the concepts that are often mixed in political debate: a grant is not a loan, trade is not an automatic aid, reparations are not the same as investment and nominal growth does not yet mean a restoration of economic autonomy. Each chapter first defines the mechanism, then shows specific historical examples and eventually admits where the data are incomplete or where they admit more interpretations.
The full version goes much deeper into national time series, currency transitions, energy networks, privatization, foreign investment and post-war or transformation renewal. It also contains more detailed tables, local data materials, image sources and links between related chapters. This public version is deliberately shorter. It retains the main question, method and several representative analyses in order to assess the argument, style and scope of the work.
Who's helping who? From Lend Processing Lose to Marshall Plan and Soviet Block to Denmark, Iceland and the system view of TUS
Home: When the word "help" covers the structure of the relationship
Word Help It's one of those words that seems more understandable than they actually are. When one country provides a second money, food, machines or credit, we tend to draw a simple arrow: donor → recipient. But real economic relations are almost never one-way. In addition to money, goods, political commitments, information, standards, market access, security guarantees, technology, raw materials, labour and risk flow. Some flows are seen in the budget, others are hidden in prices, exchange rates, credit terms or who may change decisions later.
That is why it is misleading to ask only: How much did you get? More precise questions are: Under what conditions? In what form? Who was the user? Who was the one who was the one who was the one who was the one who was the one who was the one who was the one who was the one who was the one who was the one who was the one who was the one who was the one who was the one who was the one who was the one who was the one who was the one who was the one who was the one who was the one who was the one who was the one who was the one who was the one who was the one who was the one who was the one who was the one who was the one who was the one who was the one who was the one who was the one who was the one who was the one who was the one who was the one who was the one who was the one who was the project? Could the beneficiary have refused the offer? Could he have stepped out of the system? Who set the prices? What long-term links did the aid create?
This article will therefore not be a defense of Marshall's plan or an indictment of the Soviet Union. Nor will it claim that every grant is free and every clearing business is exploitation. The goal is to look at several historical cases with the same measure and find out what really created manoeuvre area the smaller states and what narrowed it down.
There's gonna be four big stories downtown. The first is American. Lend Closing Lise for the Soviet Union during World War II: huge material assistance to a state that soon became the major geopolitical adversary of the US. The second is Marshall Plan and the dispute over whether he was primarily a generous renewal of Europe, an instrument of American exports, a means against communism, or all at the same time. I'm shaking them Soviet blocwhere early reparations, dismantling and asymmetric prices have gradually turned into a much more complex system of planned integration, investment, subsidies, energy subsidies and political dependencies. The fourth is two smaller states - Denmark and Iceland - which show that deep integration with foreign countries does not automatically mean loss of sovereignty and that sometimes the ability to negotiate the conditions of integration is more important than formal independence.
Finally comes the system view of the TUS. Not to "prove" some cosmology, but to function well here as a language for relationship between nodes, flows, feedback, local and global optimization, and the difference between the name of the system and its real function.
1. First, terms: grant, loan, business, reparation and hidden transfer
Grant is not the same as the loan
FAKT. Grant is a means that the recipient may not pay back as a principal. The loan creates a future commitment. But that does not say anything about a wider dependence. The grant may be linked to conditions that deeply alter the business or institutional environment. On the contrary, the loan may leave the beneficiary very broad autonomy if it is long-term, cheap and without political conditions.
Therefore, economic sovereignty cannot be measured by the simple share of "donations" and "loans."
The same word "aid," different economic relations
It is crucial to separate the immediate benefit from the later commitment and from the question of who can change or end the relationship for reading further chapters.
| Mechanism | What the recipient gets | What can limit a relationship | What to verify |
|---|---|---|---|
| Grant | Resources without a normal obligation to pay back principal | Purpose, selection of suppliers, political expectations | Share of actual donation, commitment, management of funds |
| Advantaged loan | Capital with softer conditions than on the market | Future instalments and programme conditions | Interest, maturity, currency, deferral, cross compliance |
| Commercial debt | Fast-access funding | Market rate, refinancing and exchange rate risk | Debt holders, currency, maturity and use of yield |
| Direct investment | Capital, production, work and sometimes technology | Owners' control, profit outflow and dependence on one investor | Real owner, local added value and possibility of change |
| Infrastructure and concessions | Long-term asset or public service | Operational commitments, guarantees and control of the strategic hub | Life cycle, maintenance, guarantees, income and ownership transfer |
The store can hide the transfer
The second mistake is the idea that, if there is a consideration, it is neither aid nor extraction. Depends on the price. If the State supplies the commodity at a significantly lower price than it would have obtained elsewhere, the difference between the market and the administrative price is an economic transfer, even if the transaction is formally conducted as a transaction.
As simple heuristics can be used:
[ T _ {hidden} = Q (P _ {alternative} -P _ {charged}) ]
where Q is the quantity and price difference is the implicit flow of value between the parties. It is not a universal accounting method - an alternative market price may not always be available and sometimes there are transport, qualitative or political differences - but it forces us to look at the nominal invoice.
Reparations are not development aid
Post-war reparations are a special category. The winning state does not see them as a gift from the loser, but as compensation for the damage that has been done. However, for the economy of the slaughtered country, the effect is similar to that of the forced capital outflow. Therefore, when assessing the post-war development of Germany, Hungary or Romania, we must separate the question legal and moral entitlement to reparations from question the economic impact of their particular selection method.
Assistance may be beneficial to both parties at the same time
One of the biggest mistakes in the political debate is a false choice: either it was altruism or it was an interest. In fact, both motives can be present at the same time.
If the US finances the purchase of American machinery, it can simultaneously:
- to help the European factory to resume production,
- create a contract for an American manufacturer,
- increase future European demand,
- stabilise the Allied State Government,
- to reduce the risk of political chaos.
The fact that the program helped US exports does not in itself refute Europe's contribution. On the contrary, the real contribution to Europe does not prove that the programme did not have a geopolitical purpose.
2. Lend Closing Lase: Helping a future opponent
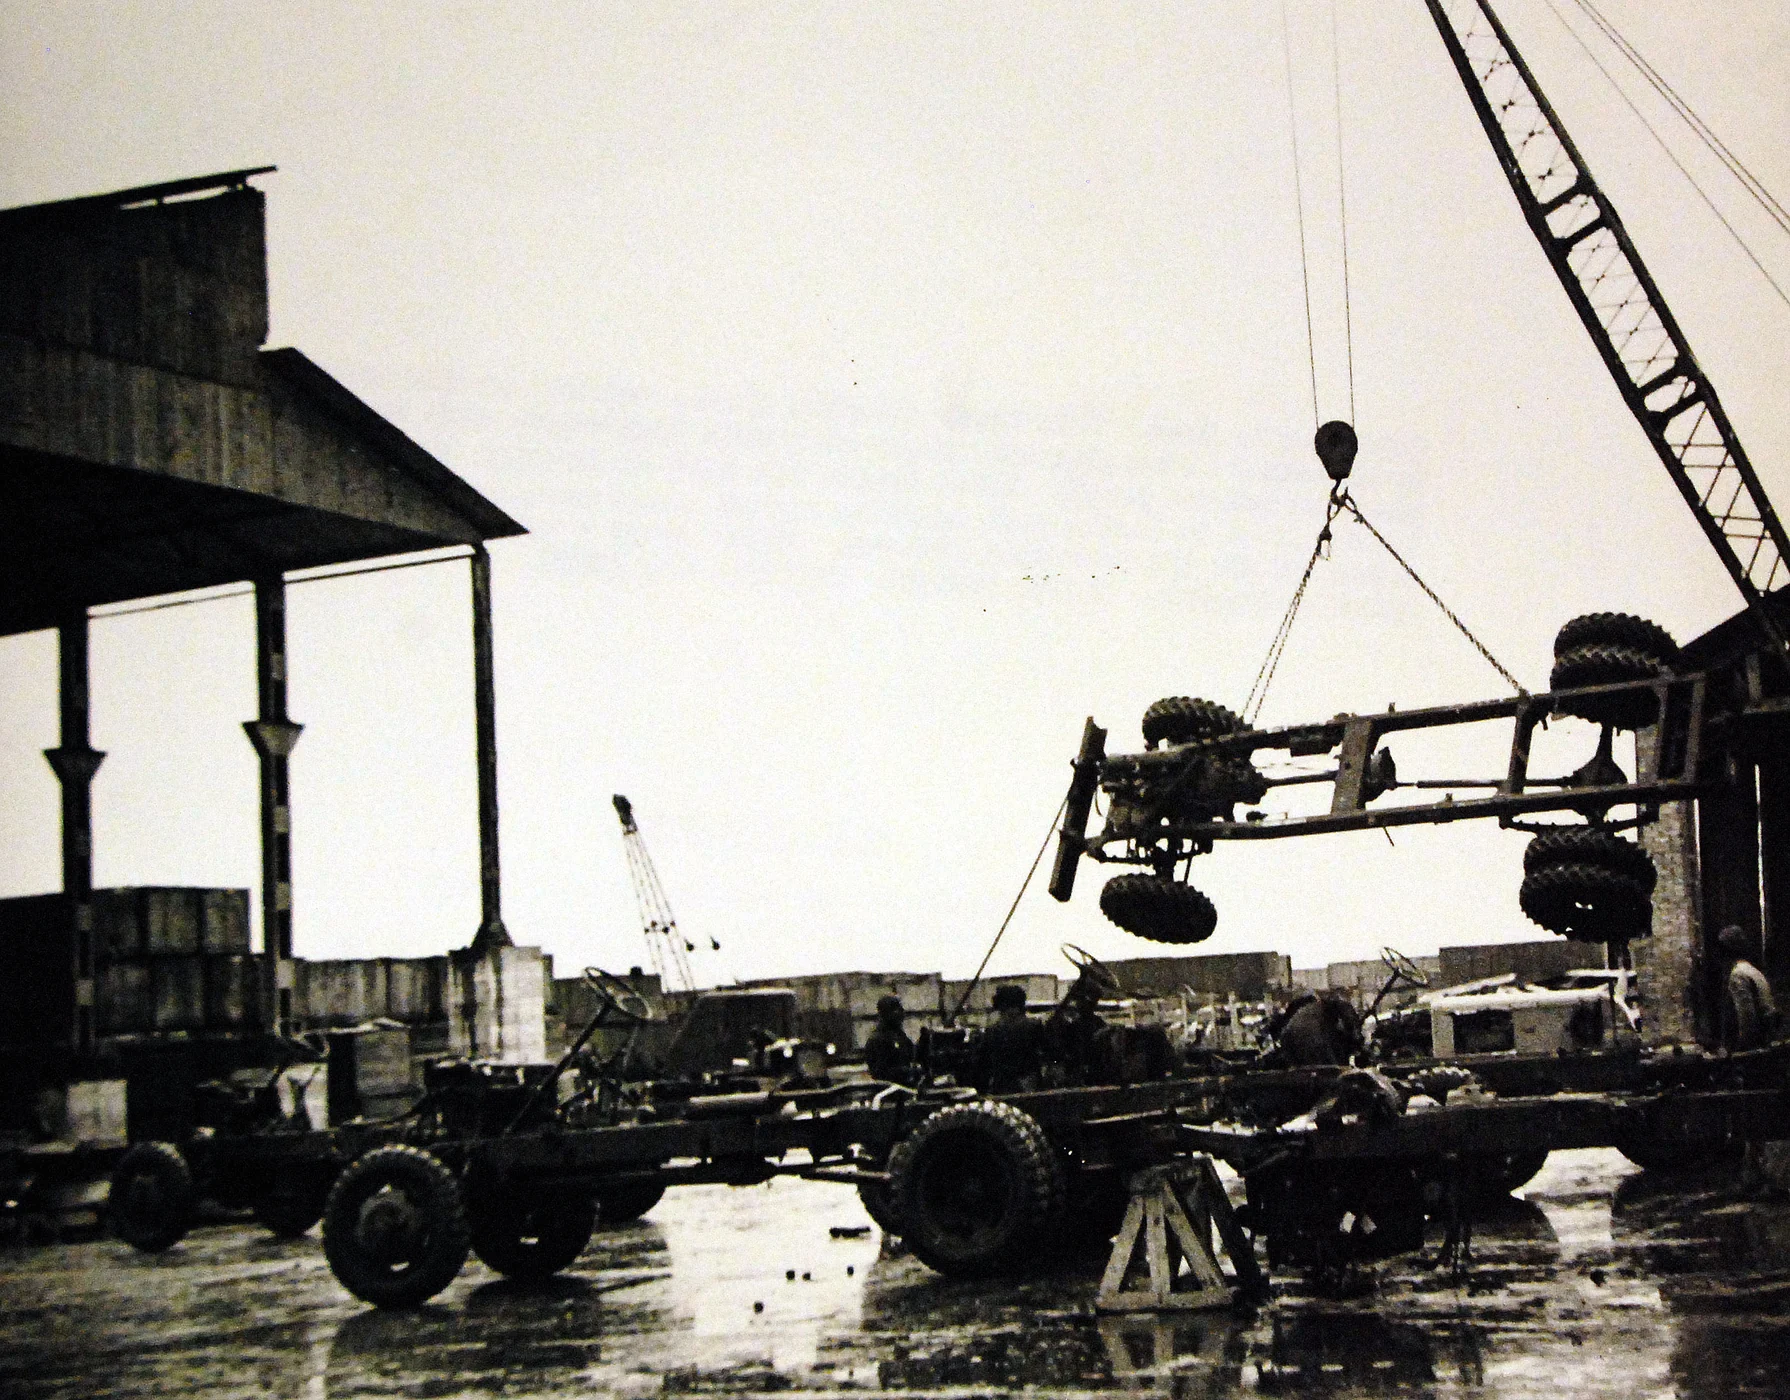

What the United States really delivered to the Soviet Union
FAKT. The US government documents state that the total value of Lend's' Lasse 'aid to the Soviet Union during the war was approximately 11.1 billion dollars back then. The document of the US Ministry of Foreign Affairs of 1947 mentions this amount as the total aid provided under the June 1942 Agreement. FRUS 1947
Popular debate often focuses on tanks and planes. These were important, but systemically even more fundamental were items that removed logistics narrow throats: trucks, railway equipment, food, industrial machinery, aluminium, explosives, cables, air gasoline and other materials. The National WWII Museum recalls the scope of the vehicle supply and their importance for the mobility of the Red Army. National WWII Museum
Here is the important system principle: the share of total production may not correspond to the share of the resulting performance of the system. If you have enough tanks but not enough trucks, the problem is not another tank, but logistics. A small entry into a critical bottleneck can have a greater effect than a much larger entry into an area where capacity already exists.
Lend Preparation didn't win Moscow - and yet he was important
FACP + INTERPRETATION. In the most critical phase of 1941- 1942, American aid was still relatively limited and some early supplies came from Britain. This implies that the US's claim to save the USSR from defeat at Moscow is too strong. But the opposite is the opposite of the claim that Lend-Lise was negligible. Its importance grew with war and it was very much reflected in mobile offensive years 1943-1945.
The more correct wording is: The Soviet Union carried the vast majority of the human and industrial costs of the war on the eastern front, while US and British aid removed several critical material and logistical constraints and allowed domestic industry to specialize in weapons.
This will avoid both propaganda extremes.
It wasn't a regular debt for the whole delivery
The common claim is that the Soviet Union owed the US $11 billion after the war. That's inaccurate.
Lend's construction of the Lend-Lase was strange. Material consumed or destroyed during the war was not charged as a normal commercial purchase, which would have waited for full repayment after the war. The US Party requested financial settlement in particular for: the civilian items that remained in existence at the end of the war, and some later transfers. In 1948, the American note explicitly acknowledged that their peace value could be significantly lower than the original war price. FRUS 1948
The US period calculation worked with an inventory of civilian items and industrial equipment in the order of several billion dollars, not a simple invoice for the entire program. FRUS 1947
This is essential for our later question: Moscow in 1945 was not a state that simply sat under US 11 billion debt and wanted to avoid any further commitments.
On the contrary: Moscow itself asked for a large US loan
FAKT. In January 1945 Molotov submitted a request to the American Party to: $6 billion long-term post-war loan with a maturity of about 30 years and low interest. FRUS, 8. 1 January 1945
In August of that year, Soviet General Rudenko requested in writing Billions of loans from Export, it's 2 percent export, it's 2 percent import. FRUS 1946, summary of credit negotiations
More interesting, part of the US administration was considering an even bigger offer - until $10 billion for a long period of low interest, one of the considerations being the repayment or option of strategic Soviet raw materials. FRUS, preparations before Yalta
This is a simple hypothesis that the USSR rejected Marshall's plan mainly because it "no longer wanted to be indebted to America."
The more accurate question is:
Why did Moscow want US bilateral credit, but reject the multilateral architecture of Marshall's plan?
And it is the answer to that question that brings us from money to power over the rules of the system.
3. Marshall Plan: Money, Goods and Institutions
How many grants and how many loans
FAKT. The often repeated ratio of 85% of grants and 15% of loans is only gross. One of the most frequently used summary summaries indicates the total ERP means USD 13,3258 billion, of which 11,8207 billion grants and 1,5051 billion loans. This corresponds approximately to 88,7% grants and 11,3% loans. The period-time country-by-country overview is reproduced, for example, in the Conventional Record and in Marshall Foundation materials. Conventional Record - ERP table
The figures may vary according to the exact time cut, the netting of conditional assistance, regional funds and subsequent recalculations. For example, for the grant part for April 1948 to June 1951, the OECD reports USD 11,7805 billion. OECD - The Marshall Plan
That's why it's more honest to write that Marshall's plan was mostly grant, the credit part was much more significant in some countries than in others.
The loan on American goods was a real commitment
Here is an important objection: if the State has received the credit part of the aid and used it to purchase US commodities or equipment, the commitment to repay the loan was borne by that State. That's not a negligible detail. Some countries had loans relatively small, others much larger. Ireland, for example, has benefited from a significantly larger share by way of credit than most of the main beneficiaries.
At the same time, however, most of the funds were not loans. It cannot therefore be described as the whole Marshall Plan as a mechanism "America lent Europe to buy American goods and then Europe paid it back." Such a formulation mixes the grant and credit component.
More precisely:
The US has mainly supplied grant aid and a smaller credit component; much of the assistance has financed imports of US commodities and equipment, while beneficiaries have simultaneously created domestic counter funds and adopted the rules of the joint recovery programme.
Counterpart funds: the most interesting mechanism, which is hardly talked about
Marshall's help was simply not a bag of dollars passed on to the European government.
Grant deliveries were often handled by American aid financing the import of goods. The European importer paid for these goods in his domestic currency and the funds were deposited into a special account - counter. The US-US-European agreements provided that the use of these local funds would be the subject of an agreement between the beneficiary and the Economic Cooperation Administration. FRUS 1948 - bilateral agreements and counter-part funds
Counterpart funds could finance domestic investment, sovereign debt reduction or other non-inflationary purposes. The American Party had some influence on their release, so it was not a grant without any supervision. The historical Marshall Foundation reports describe that the local monetary equivalent of US grants has been deposited into special accounts and its use has been coordinated with the ECA. Marshall Foundation - Retrospective
This shows exactly why the form of "gift 'does not mean zero institutional conditionality.
The programme required coordination, information and bilateral agreements
The Economic Cooperation Act envisaged that beneficiaries cooperate on a joint recovery programme and each state would conclude a bilateral agreement with the US. FRUS - Economic Cooperation Act
American internal preparations discussed budgetary reforms, exchange rates, removal of trade barriers, the use of local counter funds and the extent to which the US should demand reforms or concessions. FRUS 1947
That's exactly the part that was a problem for Moscow.
4. From early extraction to redistribution: the USSR to Stalin is not one immutable model
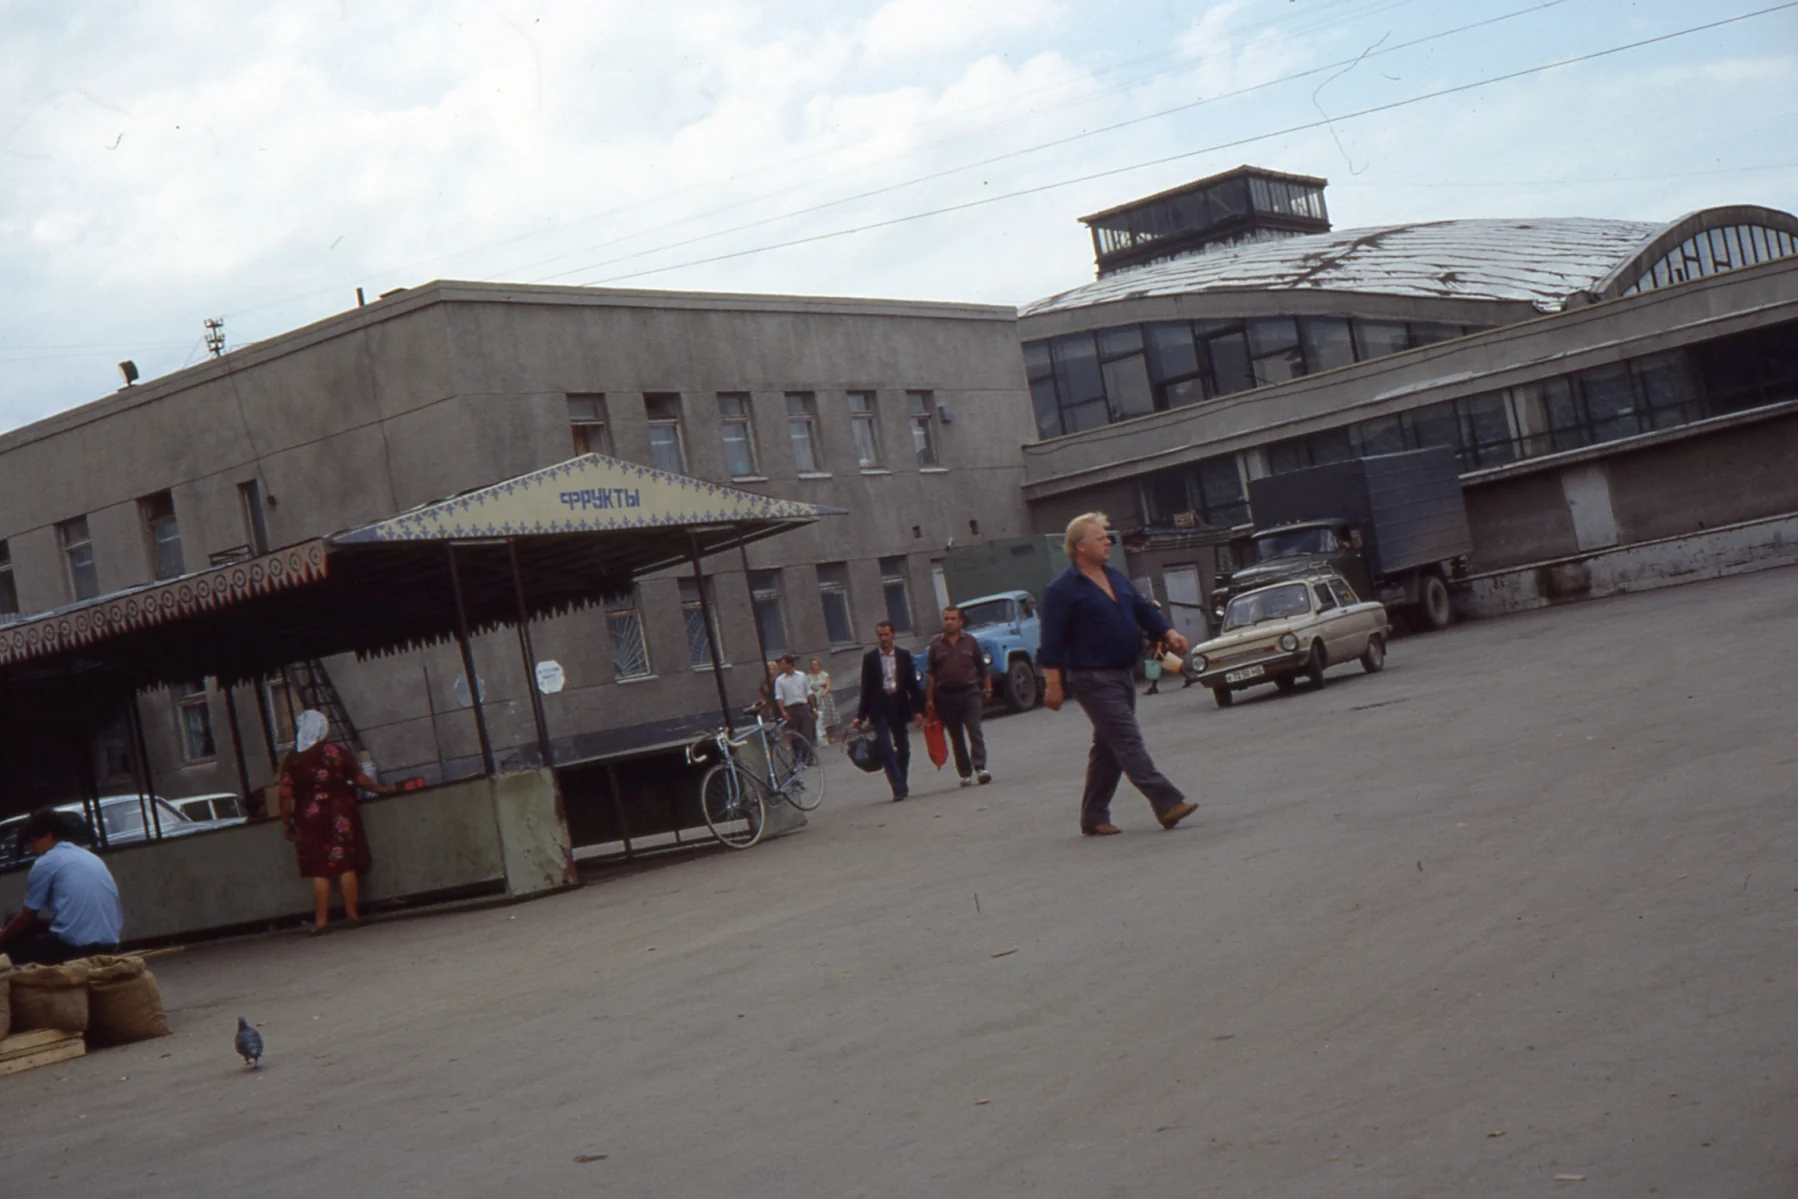

Why is it a mistake to project 1947 until 1987
One of the biggest methodological errors in assessing the Soviet bloc is that several decades of economic development is being rolled into one sentence. Indeed, the early post-war period contained hard reparations, dismantling, forced pricing relationships and politically asymmetrical forms of trade. However, it does not follow that the same net flow of resources and the same institutional logic continued without change until the break-up of the USSR.
After Stalin's death, the structure of relations within the USSR and between Moscow and the state of the RVHP changed. In addition to political control and centrally determined specialization, massive investment and fiscal flows have also developed towards poorer republics. From today's perspective, it is important to separate three different mechanisms:
- extraction - the centre receives a resource under conditions which are not favourable to the periphery;
- redistribution - the richer parts of the system finance services or investments in poorer regions;
- specialization - the centre invests in a certain sector of the region, but at the same time it binds it to the rest of the system.
One project may contain all three elements simultaneously.
For example, a irrigation system, a power plant or a metallurgical plant can increase local productivity and create jobs. At the same time, however, it can be designed so that its inputs, customers, transport, prices and financing make economic sense only within the Union-wide plan. After the centre's collapse, physical infrastructure will remain, but part of the relationships that gave it a function will cease.
This is what became one of the main problems of the successor states after 1991.
Fiscal transfers between Republics
FAKT. In a retroactive analysis of Soviet fiscal federalism, IMF shows that the late USSR contained an important mechanism for inter-redistribution. In 1989, intergovernmental transfers accounted for about 6.5% of the Union budget; the Republic's specific grants were almost exclusively directed to Central Asia. IMF - Fiscal Federalism and the New Independent States
The figures for 1991 are even more graphic. The IMF lists the Union grants as a share of GDP, for example, around:
- Tajikistan: 19,0% of GDP,
- Uzbekistan: 18,5% of GDP,
- Azerbaijan: 13,6% of GDP,
- Kyrgyzstan: 12,4% of GDP,
- Turkmenistan: 8.3% of GDP,
- Kazakhstan: 4,5% of GDP.
Such values cannot be described as marginal. For some Republics, the demise of the union transfers has been an immediate macroeconomic shock.
INTERPRETACE. But this does not automatically mean that it was "altruism of Moscow." Redistribution was part of a centralised system, in which the Centre also determined a significant part of the investments, prices, production tasks and trade. The poor Republic could receive substantial transfers while at the same time having a very limited opportunity to identify its own economic strategy.
This is another reason why there is no sense in measuring sovereignty only by financial balance.
Investments in education, science and human capital
After 1991, the Soviet Republic did not just inherit factories and pipelines. They also inherited large institutional infrastructure: schools, universities, research institutes, hospitals, vocational education and technical cadres.
In Central Asia, especially, the Soviet era has meant a huge expansion of literacy, technical education, female participation in education and institutionalised health care. However, these processes cannot be read as "a gift from the periphery centre." At the same time, they were both an instrument of modernization and integration of the Republics into a single political and economic space.
In assessing today's vocational education in Kazakhstan, World Bank explicitly describes the current system as a legacy of the Soviet model: centrally planned, funded and managed vocational schools with uniform standards. World Bank - Kazakhstan TVET
This example shows well the dual heritage: high institutional capacity and physical network on the one hand, rigidity and low autonomy on the other.
Infrastructure as an asset and liability
Roads, railways, irrigation channels, water systems, electricity networks and industrial complexes are physical capital. But capital requires maintenance.
After the collapse of the USSR, it has been shown in some Republics that the inherited infrastructure was designed to be a pan-Union economy and its maintenance exceeded the fiscal possibilities of new states. To date, World Bank describes in some parts of Central Asia an ageing water and energy infrastructure built in the Soviet period, which, after decades of inadequate recovery, creates new costs. World Bank - Central Asia water infrastructure
This reminds of a simple but often overlooked principle:
Infrastructure is not a one-time gift. It's a long-term commitment to maintenance, modernization and adaptation.
When the institutions that financed its operation disappear, the asset may gradually turn into a cargo.
5. Russia in the '90s. Years: collapse of the old system, import of reforms and institutional vacuum
American advisors were real - but they weren't the only cause
The debate about Russian transformation often slides towards two contradictory myths.
The first one says:
"Russia has destroyed its economy."
Two:
"American advisors deliberately robbed Russia."
Both sentences are too simple.
FAKT. Indeed, the US government has financed extensive technical assistance. In 1996 / 1997, GAO described in detail the activities of the Harvard Institute for International Development, funded by USAID, in the construction of the Russian capital market and the legal framework of economic reforms. U.S. GAO - HILD
Western advisors had access to part of the Russian reform elites and participated in the proposals of privatisation, legal and capital institutions.
But it doesn't mean they're the autonomous control center of Russia.
The Russian Government and Parliament made their own political decisions. At the same time, the country was already hit by the breakdown of outlets, currency space, supply chains and the fiscal structure of the former USSR before the main privatisation wave.
The correct question is therefore not:
Who's the only one who destroyed Russia?
but:
How did the disintegration of old institutions, domestic political decisions and foreign reform paradigms become mutually stronger?
Privatization before institutions
World Bank described one of its key problems very openly in the re-assessment of Russian privatization. Voucher privatization quickly moved the property into private hands, but the idea that private ownership itself automatically creates pressure on quality institutions did not come true. World Bank - Russian transit assessment
A large proportion of the businesses ended up being owned by insiders. Legal protection of minority shareholders, judicial enforcement of contracts, transparent accounting and capital market regulation were weak.
Later programme loans-for- shares in 1995- 1996, the situation was even worse. World Bank described it as a non-transparent transfer of shares in extremely valuable oil and metallurgical enterprises for relatively low amounts, which solidified financial and industrial groups and the creation of oligarchic ownership. World Bank - privatisation assistance assessment
Systemically, there is a very important principle:
Import of the form of ownership is not an import of a functional market.
The market is not just a set of private owners. He needs courts, information, reliable accounting, competition, banking supervision, enforcement of contracts and rules of conflict of interest.
If you remove the old coordination system faster than the new one, there may not be a "free market" between them. May arise Coordination vacuum.
In this, actors with the best access to information, capital, administration and political contacts gain the advantage.
Debt to IMF: addiction or temporary bridge?
Russia is in the 90's. the years have become an important IMF client at the same time.
The official IMF data show the final state of Russian commitments to the Fund around:
- 1992: 719 miles. SDR,
- 1995: 6,47 billion SDR,
- 1997: 9,81 billion SDR,
- 1998: 13,73 billion SDR,
- 2000: 8,91 billion SDR,
- 2003: $3.41 billion SDR.
IMF - The IMF and Russia in the 1990s
In January 2005, Russia paid off the rest of its liabilities before the deadline; IMF reported around USD 2,19 billion, about USD 3,33 billion. IMF - Early Repayment 2005
This curve is analytically much more interesting than the simple phrase "Russia was indebted to the West."
It shows the stage at which the internal transformation crisis overlapped with the growing need for external financing, and then a rapid turnaround at the beginning of 21. A century.
But we must not mix up several types of commitments here either. IMF is not the US. In addition to IMF, there was debt to the state creditors associated with the Paris Club, liabilities assumed after the USSR, Eurobonds, commercial bank debt and private corporate liabilities.
This is why the data part of the article will be kept separate from those categories.
6. Debt as a history of relationship, not a moral score
What debt tells us - and what not
In public debate, debt is often used as a moral indicator.
"Learned country" sounds like an irresponsible country.
"Unindebted country" sounds like a disciplined country.
Historical examples above show that such an interpretation is dangerous.
Romania had 80 at the end. a flight of almost paid off foreign debt, but paid for it by underinvestment and hard consumption restrictions.
Poland had a high old debt, but it acquired its major restructuring and created a new growth model.
Moldova started almost without debt and reached almost 50% of GDP over a few years.
Russia has taken over the old Soviet debt and in the first decade of the new century has prematurely paid up a significant part of official foreign liabilities.
The GDR did not have a classic foreign transformation debt because its costs were largely socialized within a united Germany.
Therefore, the data part will work with the debt profile, not just one percentage:
[ D _ {risk} = f (D / GDP,\ D / export,\ currency,\ maturity,\ interest,\ creditor,\ use,\ refinancing) ]
This equation is not an econometric model. It's a checklist.
Two countries with the same debt of 50% of GDP may be in a completely different situation:
- the first has long-term domestic bonds in domestic currency and high tax revenues;
- the second has a short-term dollar debt to foreign banks and low foreign reserves.
Nominably the same number, systemically different world.
IMF: loan, stabilization tool and source of conditions
IMF provided the transition economies between 1989 and 1997 approximately USD 27 billion loans. The first major wave went to Central and Eastern Europe, for example Czechoslovakia, Hungary and Romania; the second wave followed mainly in the middle of 90 at the Baltic, Russia and other post-Soviet countries. flight. IMF - Ten Years of Transition
This flow can be interpreted in two too simple ways.
The first one says:
IMF saved the country from financial collapse.
Two:
IMF forced neoliberal policies on countries.
Both descriptions may capture part of reality, but neither is enough.
IMF loans did indeed provide foreign exchange exchanges that helped restore reserves, stabilise monetary systems and manage due foreign liabilities. At the same time, they were linked to conditions: fiscal objectives, monetary policy, liberalisation, restructuring or institutional reforms.
So from the perspective of our article IMF, there is neither charity nor simple creditor.
It's financial node that supplies liquidity in exchange for the possibility of influencing part of the programme rules.
This does not mean that every IMF request was wrong or good. This means that the economic sovereignty of the beneficiary is objectively more shared during the programme than in a situation where the State does not need funding.
Direct investment versus credit: two different types of addiction
Hungarian experience shows the difference between foreign credit and direct investment.
If a foreign investor buys a billion-dollar factory, the state doesn't have to pay back a billion-dollar factory later.
But the investor will acquire ownership of the asset and the right to future profits.
If the state borrows a billion and keeps the factory, it retains ownership, but it has to pay back principal and interest.
Not one model is automatically better.
Therefore, for the assessment of foreign direct investment, it is necessary to monitor:
- whether it was a new plant or only the sale of an existing asset;
- how much reinvestment followed,
- whether domestic supply chains have been created,
- how much profit is reinvested and how much is repatriated,
- whether the investor has brought technology and export access,
- whether a monopoly is generated.
Only then can we say something reasonable about whether foreign capital has increased or reduced the country's long-term manoeuvre space.
Hidden infrastructure debt
We have to add one more type of commitment to our model that the public debt accounting statistics do not see.
The State may have a low financial debt and at the same time:
- the crumbling road,
- obsolete power plants,
- unmaintained water pipelines,
- Underfunded railways,
- old hospitals,
- technologically obsolete industry.
That's all deferred future expenditure.
Call it work. infrastructure debt.
In 1991, the Soviet Republic inherited a large number of physical infrastructure, but at the same time it was obliged to maintain it without a union budget. Romania entered into a transformation with low foreign debt, but part of the capital equipment was obsolete due to previous import compression. On the contrary, East Germany was given an extraordinary capital inflow precisely to close the infrastructure gap quickly.
This brings us back to the main theme of the article:
The accounting flow is not the whole system.
The economy may look formal in its own way, but it may use its own capital base.
7. First comparative synthesis: several different routes after 1989 / 1991


Four idealized transformation models
We can divide cases so far into four idealized types for orientation. These are not fixed categories; some countries have been moving between them over time.
Model A: fast institutional redirection
Examples: Estonia, Latvia, Lithuania, part of Central Europe.
Characters:
- rapid liberalisation,
- relatively fast privatisation,
- foreign investors,
- harder currency regime,
- fast redirection of the store,
- European institutional anchor.
Risk: rapid initial social and industrial shock, migration, loss of some of the old production.
Model B: High FDI transformation
Example: Hungary, later also a significant part of the Czech Republic, Slovakia, Poland and Romania.
Characters:
- sale or construction of enterprises to foreign strategic investors,
- rapid integration into transnational production chains,
- import of technology and management,
- increase in export performance.
Risk: high foreign ownership control and outflow of part of dividends.
Model C: Maintaining state coordination and old ties
Example: Belarus, some of the Central Asian states.
Characters:
- slower privatisation,
- large-scale state-owned enterprises,
- administrative prices or loans,
- maintaining traditional trade links.
Advantage: minor destruction of some production structures in a short period.
Risk: technological lagging, low competition and dependence on price or energy transfers from the dominant partner.
Model D: Breakdown of coordination without fast-track compensation
Examples in Part 90. Flight: Russia, Ukraine, Moldova, some Caucasian and Central Asian states.
Characters:
- rapid breakdown of the original planning system,
- weak new institutions,
- monetary and fiscal problems,
- barter, arrears, non-monetary payments,
- high uncertainty of ownership rights.
It is this model that can create the deepest decline, because the economy will find itself in space for a certain period of time. "neither plan nor market.". IMF described this situation in an analysis of the Eastern European slump at the beginning of 90. flight. IMF - Output Decline After Reform
Why no model is clean
This type of science is deliberately rude.
Poland, for example, combined rapid macroeconomic stabilisation with the massive emergence of new private firms and later foreign investments.
The Czech Republic started with a voucher privatisation, but in the following years it was strongly integrated through foreign industrial investors.
Kazakhstan has created a market and investment regime around energy, while maintaining a significant role in key sectors.
Uzbekistan was a long-time graduate, but later it significantly opened up a part of the economy.
After a chaotic privatisation decade, Russia has once again strengthened state control in strategic sectors.
Therefore, the interactive table will be more important than any ideological label. Allows readers to choose two or five countries and watch specific series in timeInstead of accepting our verbal categorization.
How the data layer verifies the claims
The background data layer shall include:
- metadata of all 15 post-Soviet republics,
- the main states of the former Eastern bloc,
- GDR as a special case,
- Yugoslavia and Albania as a separate socialist trajectory,
- Denmark and Iceland as control Western cases,
- First series of Soviet transfers,
- Russian debt to IMF,
- early post-Soviet foreign debt ratios,
- Hungarian FDI and net foreign debt,
- transfers to East Germany,
- current basic indicators of Central Asia.
The following are particularly decisive for the comparison between countries:
- a single-base real GDP index;
- GDP per capita in both current and PPP prices;
- public and foreign debt;
- IF exposure;
- FDI;
- remittence;
- demography;
- structural breakdowns and conflicts;
- integration milestones;
- the source of each individual data.
That way, not only will there be an article, but Reproducible historical-economic data sheet, from which further graphs and articles can be generated later without manual recollection.
The transformation decline was not the same in all countries
Move the year of bottom and select the countries for comparison. This is a historical summary published by the IMF in 2000: shows a cumulative decline in production from 1989 to the recorded minimum. This is not an annual curve and the latest statistical revisions are not mixed back.
Source: Stanley Fischer, Taking Stock. The decrease is shown as a positive percentage of loss; the starting year = 1989.
8. 2025 as a control section: what really decides after 30 years
Why is it not enough to write the latest available GDP into the historical table
METODIKA. The comparison of economies from 1989 to 2026 cannot be a simple extension of one column of GDP. Each country has undergone several changes to the regime: price, trade, currency, demographic and often security. In addition, the last year of the time series may be a preliminary result, an estimate or a forecast. Annual observations should therefore be separated from quarterly data, forecasts and verbal evaluations. When the EBRD talks about growth in the first half of 2025 in the 2025 evaluation, it is a year-on-year change in this semester, not a complete growth in the full calendar year. EBRD - Central Europe and Baltic; EBRD - Central Asia Evaluation.
So when assessing transformation success, we have at least four separate layers. Production layer It says how much money was produced in the economy. Distribution Observes who has received wages, profits and social services. Institutional layer shows whether the State collects taxes, enforce contracts and prevent systemic crises. A strategic layer examine whether the country can change customers, transport corridor or energy source without losing a significant part of its production capacity. Success in the first layer may be accompanied by failure in the fourth. Even the high growth rate alone does not prove the stability of the model.
In the data annex, we therefore need a separate overview of the current structural problems of individual countries, alongside the annual time series. It does not have to be pretended to be accurate figures: for example, "weak diversification of exports' is an institutional and sectoral description, while" 11.4% of annual growth over ice-June 'is a time-limited statistical figure. Both types of information can be used in one argument, but only in clear labelling.
Czech Republic and Slovakia: same federal base, different risk structure
FAKT. In the EBRD evaluation report for 2025-2026, the Czech Republic is described as an economy where growth in 2024 was 1.2% and 2.4% year-on-year for the first half of 2025. At the same time, the EBRD highlights the need for stronger innovation capacity, efficient use of European funds and investment in a modern energy network. EBRD - Czechia country assessment 2025-26.
For Slovakia, EBRD describes the weakening economic activity during 2025, especially the sensitivity of the automotive industry to trade barriers and the problems of replacing part of the Russian gas supply to date. It also draws attention to the weaker use of European funds: 9,1% of the relevant cohesion policy funds for the period 2021-2027 were exhausted at the end of July 2025, according to its overview. This is an indication with a specific date and definition; it cannot be transferred to all EU funds or to the whole year 2025. EBRD - Slovak Republic country assessment 2025-26.
INTERPRETACE. The Czechoslovak Federation was one common production and social area in 1992. After more than three decades, both countries are firmly anchored in the European market, but their weaknesses are not the same. The Czech Republic is mainly addressing the shift towards higher technological added value and a lack of equity risk capital, while Slovakia is sensitive to the concentration of export sectors and selected energy inputs. This distinction is not a verdict about a better or worse population, but an argument for measuring dependency structures: number of independent export sectors, geographical location of customers, share of domestic research and development and the possibility of replacing key energy input.
If the economy has very powerful plants belonging to foreign companies, it is necessary to find out what part of research, investment and profit decisions it retains at home. The foreign owner may not be a problem: he can bring technology and stable orders. The risk arises when the exit of a single investor or the change in its global product strategy creates a shock comparable to the failure of the entire domestic sector. This mechanism cannot be calculated solely by the share of automotive exports in total exports; it requires analysis of supply networks, domestic added value and retraining options.
Poland: economic performance and new fiscal constraints
Polish experience is described as an example of long growth after a relatively slight initial transformation decline. In the early '90s. But its trajectory has also been significantly influenced by the restructuring of foreign debt and later European integration. For the current stage, it is instructive to see how the successfully diversified economy copes with new budgetary commitments.
FAKT. The EBRD in its report 2025-2026 states that Polish activity is supported by consumption and investment co-financed by European funds, but at the same time it draws attention to the high government deficit and the pressure of defense, health and energy spending. It mentions the creation of a fiscal council and the need to better mobilise domestic savings and private investment capital. EBRD - Poland country assessment 2025-26.
That is precisely why you avoid a simple ranking of states by debt. Investments in rail, networks or technological innovation may expand future productive capacity. The budget deficit financing unsustainable operating expenditure has a different time profile. However, we cannot always safely determine which expenditure is productive from the balance of accounts itself: infrastructure can be poorly designed, while health prevention or education can be economically paid after years. For Poland, therefore, we will monitor not only the deficit and public debt in the data expansion, but also the quality of public investment, the domestic capital market and the structure of future commitments.
Central Asia: the same Soviet heritage, other limits in 2025
FAKT. EBRD 2025-2026 shows annual real GDP growth for Kyrgyzstan 11,4% in the first half of 2025 and for Tajikistan 8,1% in the same half-year. At the same time, Tajikistan is a growth 8,4% in the whole year 2024. These three numbers shall not be compared to three equally defined annual observations. EBRD - Central Asia country assessments 2025-26.
Kyrgyzstan and Tajikistan showed significant transformation declines in the 1990s, the causes of which included the breakdown of the Union's budgetary ties and very different domestic events. Today's high growth is therefore not a "wipe-off" of the economic downturn at that time. It may come from a low starting base, services, public investment and household foreign income. Moreover, Tajikistan remains sensitive to the situation in the Russian labour market, where a substantial part of labour migration is heading. The EBRD therefore explicitly recommends diversification of migration opportunities. EBRD - Tajikistan country assessment 2025-26.
Kazakhstan is another mechanism. The EBRD describes the acceleration of growth in the first half of 2025, linked to the increase in oil extraction in the Tengiz oil field, while highlighting the modernisation of public services and fiscal reforms. The oil rent may finance infrastructure, education and reserves, but with a high concentration of exports it creates sensitivity to the price of raw materials and to the availability of transport routes. More precisely than the question of 'how much oil has been exported by the State', the question is how much income he has used to create alternative, more technologically demanding production capacity. EBRD - Kazakhstan country assessment 2025-26.
Uzbekistan is linked in the same assessment to strong remittances, high gold prices and a new privatisation agenda. If a higher price of gold increases export yield on one occasion, it may not be higher industrial productivity. If the privatisation revenue increases the state budget one time, it may not be a recurring income. And if remittances promote domestic consumption, they can also cover the lack of a supply of high-quality jobs in the country. These restrictions do not claim that the revenue in question is inconvenient. They only define, what can and cannot be derived from. EBRD - Uzbekistan country assessment 2025-26.
Turkmenistan: statistical accuracy is not the same as knowledge accuracy
For Turkmenistan, quality limits on springs should be highlighted. FAKT. The EBRD draws attention to the limited reliability and openness of public economic data, the difference between the official and parallel exchange rates and the difficult availability of foreign currency. In energy, it describes the attempt to diversify export routes, while geographical location without direct access to the sea and the political nature of transit corridors continue to limit alternatives. EBRD - Turkmenistan country assessment 2025-26.
INTERPRETATION. For such a State, the published GDP value has a different degree of verifiable than for a economy with regular open national accounts. It cannot therefore be put in the seemingly accurate order of the States without reservation and a few percentage points of difference can be commented on. The official exchange rate may also have limited value of purchasing power or availability of imports. Therefore, any public comparison with the figure must also indicate the limitations of the statistics.
For all states, we must distinguish at least two types of uncertainty: a natural statistical revision of normal macroeconomic data and systemic opacity, where assumptions are not available, source series or independent control. If the indicator contains only the first type of uncertainty, we may compare it with caution. If the second part is present, the analytical section shall contain a significantly stronger reservation.
How national comparisons remain readable without overlapping the main text
The main text is to show the mechanism and its consequences. However, large tables have their own place: separate page of graphs and tables, connected to the data explorer. The analysis of transformation sinks will therefore be based on a chart of historical minima, while the international comparison of annual indicators will open up data series. The interactive map will remain separate.
The important thing is not to present the graphic as an automatic proof of causality. High annual growth does not say whether energy vulnerability has diminished. A high proportion of remittances may promote consumption, but may reflect a lack of domestic jobs. The FDI's large inflow can be the construction of a new factory or the purchase of an old company. And low foreign debt can be the result of financial discipline, high export revenues, unavailability of credit or hard restrictions on imports. As important as the numbers themselves, it is therefore possible to open their definition, source, time range and methodological note by clicking.
On the contrary, visualization needs firm rules: you cannot connect different units into one curve; if there is no verified data between two years, the graph must not automatically pretend to be continuous development; the half-yearly number must not occupy the cell of the annual indicator; and CSFR, Czech Republic and Slovak Republic remain separate statistical entities. The text and graph are then not two competing versions of history, but two complementary methods of checking one argument.
How high is the legal minimum wage against the standard wage?
The share of the minimum on median or average wages shows how close the legal lower limit of the middle of wage distribution is. Compare two countries and change the year; nominal amounts in different currencies are not compared here.
The values are a percentage of the median or average, not the amount in currency. Source: OECD Earnings Data Explorer; annual coverage varies by country and indicator.
9. Comparison to be checked: national trajectory and statistical boundaries
Why we need a common time cut and we must not all consider all countries to be the same
FAKT. The World Bank publishes GDP indicators, population and a number of other variables in the World Development Indicators database through: Official Indicators API. Its public interface supports queries by country and time intervals, data from individual series and machine readable answers. However, access to data does not yet guarantee that we have analytically comparable historical sections. The new state, civil war, federation division and change in the methodology of national accounts can interrupt many in a way that simply hides the drawing of the links.
INTERPRETACE. In our comparison, 1991 is to be a common landmark, not a dogmatic base year for each index. Poland started stabilising the economy in 1990; Czechoslovakia split at the end of 1992; Estonia, Latvia and Lithuania had different routes of re-nationalisation; part of the Caucasus and Central Asian countries suffered at the same time as the transformation of the war and energy upheaval. For each series it is therefore necessary to define not only the initial year but also reasonwhy we consider it to be a useful basis.
The reader will be able to select metrics and up to several countries in the separate pages of graphs and tables. The graph will not interpolate between missing years. The displayed value must be traceable in the canonical CSV and the name of the source will be accessible directly to the record.
GDP and GDP per capita: not two names of the same output
The total real GDP describes the volume of economic production at prices of a reference period. GDP per capita adds population to the denominator. It can therefore grow even if the total output is stagnant and the population is declining. This is extremely important in countries where hundreds of thousands of workers have left, but also in ageing societies, after the transformation. On the contrary, the growing population may reduce the reported rate of GDP growth per capita even during the relatively rapid expansion of total production.
Methodological control. If a series is used GDP in current USD, its growth may reflect domestic inflation, exchange rate change and dollar prices, alongside real production. Convert it without modification to "growth of the economy" would be a mistake. A number of real GDP or annual real growth serve better for the time development in a single country. Moreover, for the material level of the population, it is necessary to examine wages, household consumption, availability of services and income distribution. Even real per capita GDP is not in itself a measure of life satisfaction.
In a short-term debate, the biggest percentage of growth often wins. But it is more important for the long-term question of sovereignty that increasing performance has created a stable tax base, the ability to repair infrastructure, finance education and manage external shocks. A country that grows up because of the temporary price of a single raw material has different options than a country with the same rapid growth based on more domestic sectors. This does not mean denying real income from natural resources; it means distinguishing the source of income from its reproducibility.
Debt-to-equity must begin with the question of who really owes whom
FAKT. World Bank lists their definitions and source organisations for the series; this is how the metadata can be obtained through Indicators API and API metadata. This is of practical importance for debt: the foreign debt according to the residence of the creditor is not the same as the government's public debt; the government's debt to the domestic bank and the foreign debt of a private firm is therefore part of various statistical columns.
If the state has a small public foreign debt, but the domestic banking sector has large short-term liabilities in foreign currency, the economy may be very vulnerable to foreign liquidity. Otherwise, the government may have a relatively high public debt in domestic currency with long maturity, but lower immediate risk of currency mismatch. Neither the first nor the second profile can be automatically assessed by a single percentage of GDP.
INTERPRETACE. For Poland, 90 are required. years include the legacy of the old debt and its restructuring. For Russia, to separate the takeover of Soviet liabilities from new IMF loans and commercial debt. On the contrary, for small post-Soviet economies, to see how quickly new official loans, energy shortfalls and bank liabilities have been created. For Ukraine, after February 2022, the chart label must explicitly explain the extraordinary war funding. The technically correct curve can otherwise become factually misleading.
Comparative pairs: Czechoslovakia, Poland and East Germany
To understand the transformation costs, it is worth comparing three different entry mechanisms, not just three resulting GDP values, to a large extent. Czechoslovakia entered into transformation as one federal state with relatively low external debt, a broad industrial base and the need to redirect a significant part of the sales. At the same time Poland was carrying a considerable old foreign debt, but it also had scope for the large-scale creation of new private businesses and gained exceptional relief from official creditors. East Germany gained immediate access to West German currency, institutions and large-scale fiscal transfers, but at the same time it has undergone a sharp change in relative prices and corporate competitiveness.
When we ask "who has reformed best," we must spread the question to at least three planes. The first is the initial debt and production structure. The second is the type of external capital available: debt write-off, direct investment, credit or federal transfer. The third is the institutional ability to convert a new resource into a permanent productivity. The comparison without these control variables cannot distinguish the State's ability from the advantage of its starting position.
It is not an argument that domestic reforms did not matter. It is an argument that reforms were carried out within different financial and geopolitical possibilities. The results are therefore not to be read as a moral order of nations or as a vote on which power is right.
Comparative pairs: Kazakhstan and Tajikistan - different external income arteries
Kazakhstan and Tajikistan inherited a common Soviet institutional environment, but not the same geography, export structure or foreign sources. The first state had strong potential for energy and mineral income, the second had a strong base in the post-Soviet period on the work of citizens abroad and their money transfers. These two income arteries have different risks: commodity prices and transit corridors, migration, labour market developments and the currency of the beneficiary countries, on the one hand.
INTERPRETACE. High oil revenues may not mean high domestic added value in other sectors. High remittances may not mean weak family prosperity, but may mean dependence of consumption and foreign exchange income on a foreign economy. Both can function as a stabilizer. Both also means a specific transfer of external shock into the home system. It is therefore important to follow the possibility of redirecting exports, diversifying jobs and building alternative sources of income to answer the question of sovereignty.
In the interactive annex, not only the percentage of oil remittances or exports, but also their time profile and available GDP base should be displayed alongside each other. The gap in the historical series will remain marked as missing observations, not as zero or a silent transition between two known points. Moreover, Turkmenistan needs to be alerted to the limited transparency of statistics. Only this presentation is consistent with the methodological rule that the illustration must not be redeemed with false precision.
10. When statistics measure the relationship: creditors, boundaries and ability to change

One debt, several true accounting views
FAKT. The concept of foreign debt is based primarily on the residence of the debtor and the creditor, not on their nationality or nationality. The debt of the Czech company to a non-resident creditor may be foreign even if the parent company is Czech. By contrast, a government bond held by a domestic bank is therefore not a foreign liability, even though it belongs to public sector debt. In practice, a further distinction must be made between government, central bank, banking sector and other enterprises. A single aggregate graph would hide these differences.
The fundamental methodological problem also shows itself among the World Bank databases themselves. World Bank Data Help Desk explains that her International Debt Statistics (DIALOGUE) a Quarterly External Debt Statistics (QEDS) may show different values for the same country. The Commission notes that the Commission has not taken into account the fact that the measures in question are in line with the MEIP. QEDS is used to be wider in institutional breakdown, has a quarterly frequency and is subject to revisions. The difference between them is not an automatic statistical error; it may reflect another method and coverage.
INTERPRETACE. For comparison between Russia, Poland, the Czech Republic and the post-Soviet republics, it is essential not to allocate all the external debt to the state. For a private production company, foreign financing can be a direct way to modernize technology. The same foreign currency may be a sensitive budgetary obligation for the government. For banks, short maturity may constitute a risk of abrupt interruption of refinancing. Three economies with the same aggregate foreign debt can therefore respond to the same foreign shock in a completely different way.
Why does the nominal dollar value not explain the debt burden
FAKT. The World Bank defines the indicator DT.DOD.DECT.CD as a state of total foreign debt in ordinary US dollars. It includes long-term public and publicly guaranteed liabilities, long-term private-guaranteed liabilities, the use of IFF credit and short-term debt according to the relevant methodology. This is not therefore the amount of the new loans granted in the year in question or the government's debt itself.
Separate ratio DT.DOD.DECT.GN.ZS used as denominator Gross national income (GNI / GNI)not automatically GDP. The names of the series are crucial here: taking a GNI percentage number and describing it as a percentage of GDP in the article would mean changing the meaning of the figure, even if the difference for some countries was not great.
The nominal dollar position may also increase between two years due to exchange rate conversions of liabilities in euro, yen or other currencies. Conversely, the decline may not mean that the debtors have paid back the corresponding sum. The debt-to-GDP / GNI ratio denominator may also change significantly for the economy affected by severe devaluation. The conversion and real financial flows must be divided.
INTERPRETACE. The only issue that is not decisive is' the country has $X billion 'debt, but a combination of questions: how quickly do the commitments grow? What currency? What is the export income economy like? Who has to refinance the debt? Who's carrying any loss? What are the liabilities under the public guarantee? It is this information that decides whether debt will turn into a crisis restriction on economic policy.
Let's not confuse debt service - actual repayments of principal and interest for a certain period - for debt. A high level of long-term payment may be less than lower than the short-term and suddenly payable commitment in one year. Therefore, the unmarked axis must not contain a status, a instalment and a percentage of exports on the graphic annex.
Borders, States Divisions and Non-Existing "Continuous Country"
For Czechoslovakia, it is essential to distinguish three different questions: how it grew Federal Economy before the division as it developed after 1993 Czech Republic and how Slovakia. It is not methodically acceptable to automatically connect the 1992 federal GDP value to the 1993 Czech value and call the result a single national time series. Such a process would create an artificial decline, given in part the change in the territorial scope.
A similar problem arises in the GDR. In comparative economic history, East Germany has an exceptional role, because it became part of another legal, monetary and fiscal system after 1990. The historical map is a legitimate map of the GDR territory for 1989. However, it would not be legitimate to allocate the German-wide value of the "GDR 'public debt in 2024 or to pretend that there is a separate current East German state budget series.
Yugoslavia cannot be drawn into the current borders of Serbia, too. The historical federation, its successor states and various war or post-war economic units have different territorial and institutional definitions. In the Soviet Union, it cannot be taken over by the USSR as a whole and declared Russian Federation because Russia has assumed most of Soviet international legal obligations.
INTERPRETACE. The map and graphs are simplified models. If they are to be useful, they must show where the measured object itself changes. A clear gap or vertical remark about the division of state is better than a seemingly smooth but false curve. Therefore, historical federations in canonical dataset are managed as separate entities and the current borders are not used for their display in the map without the explicitly mentioned historical reconstruction.
European integration: capital and institutions are not transferred by one payment
The debate on transformational results often raises the question of how much money the states have raised after joining the European Union. It's important, but it's not enough. Economic integration includes the common market, product rules, labour mobility, the competitive framework, access to bank financing, structural and investment funds, and rules on their drawing-up. Part of these changes began long before the accession through association agreements and legislation adaptation.
Therefore, one item of the budget transfer cannot be isolated after 2004 for the Czech Republic, Slovakia, Poland, Hungary and the Baltic States and issued at "price 'or" yield' for integration. The budget balance is only one financial balance. A foreign investor may build new export operations, but the ownership proceeds from such operations may not remain at home. The home enterprise may acquire a new market without any grant. Labour mobility can increase household income through remittance, but at the same time reduce the availability of workers in certain regions.
Moreover, when comparing EU Member States with Belarus, Moldova or the Caucasus, it is necessary to control the default institutions, geography and historical wars. From the very fact of subsequent prosperity, it cannot be precisely quantified what proportion of the result "has caused membership, what domestic reforms, what earlier industrial base and what change in international demand. The expert econometric literature tries to make such estimates; however, in our article such figures appear only if they are supported by a specific study and clearly identified as ODHADNot as a fact.
INTERPRETACE. Economic sovereignty in integration can both grow and fall according to a specific dimension. The State may lose autonomy in part of the regulatory rules while at the same time obtaining a greater factual choice between suppliers, markets and investors. It's not a contradiction. The formal competence and practical capacity to use this power effectively are two different variables. We will use the same standard for both the RVHP and the European Union; we will not assume the result by the name of the institution.
"Help" in crisis: who supplies liquidity and who ultimately bears loss
When foreign credit appears in the crisis, political debate often follows its nominal size. However, timing, currency and link to other funding are also important for the beneficiary. Short-term liquidity may prevent a temporary default of payments from damaging otherwise viable undertakings. The same credit may, however, extend the life of an unsustainable structure unless accompanied by a change in the causes of the problem. The result cannot be decided by simply saying "rescue" or "dictate."
Let us therefore divide crisis aid into four accounting and political moments. First arises promise financing; it may not be drawn entirely. Then comes the Drawingproviding foreign exchange or budgetary resources. Then occurs Use: stabilising reserves, financing of imports, bank intervention, repayment of an earlier commitment or other purpose. And finally settlementwhich determines whether and who pays the principal, interest, guarantees or losses in the restructuring.
These are four different events and may have different political consequences. A grant for a specific project can bring new equipment without the obligation to pay back the principal but leave costly maintenance. IFs may restore access to foreign exchange while making part of the fiscal or monetary decisions conditional on it. Direct investment will not create a state debt, but will transfer ownership rights. The agreed write-off of the old debt may release future public finances without any new cash inflow. To change these channels means to confuse both the economic effect and the question of sovereignty.
INTERPRETACE. Poland's restructuring of old liabilities, Russian drawing and later repayment of IMF loans, Icelandic banking intervention or post-war counter-part funds are very different institutions. The common question is: who has gained the opportunity to decide at what cost and for how long? Therefore, a separate data annex will not pretend to be answered by a single indicator. The graphs provide measurable traces; historical interpretation explains their conditions.
How many hours a week is it enough to cross the income poverty line?
OECD TaxBEN compares the same type of household and national rules. Choose a single parent with two children, an individual or a couple with two children and switch whether the model is counting on a housing allowance. Zero hours means that the model household reaches the limit without a work income; value above 40 hours is the mathematical equivalent, not a realistic schedule.
Indicator: weekly hours for a statutory minimum wage to reach 50% of the national median of disposable income. The housing allowance can be switched on or off; it is not a calculation of the real wage of a particular household. OECD TaxBEN Methodology.
The recalculation, not the change in fact: The period information recasting the OECD chart from 2015 gives a value of 79 hours for the Czech Republic in 2013; the official OECD graph shows it as about 80 hours. The current TaxBEN series gives 50 hours for the same year, single-minded with two children, minimum wage and a 50% median limit. The OECD confirms that the model updates and amends or changes to the calculation as necessary retroactively to the older years. The difference therefore shows a change in the historical model result, not an improvement in the living situation at the time. However, the published methodology does not explain which specific change caused the difference of 29 hours nor does it demonstrate the intention to improve the outcome. The suspicion of a more purposeful recalculation is a legitimate issue for audit, not a proven conclusion. OECD Time Chart · TaxBEN Methodology and Revision.
11. TUS: system interpretation without replacing model with proof
The network of relationships is not a map of the moral qualities of states
TUS - INTERPRETATION WRITTEN. The historical material can be modelled as a network of nodes and bonds. The node may be a state, enterprise, international institution, bank or household. The binding may be credit, business contract, migration flow, energy supply, security guarantees, regulatory condition or knowledge transfer. Each bond has direction, price, time, condition and possibility of interruption. Moreover, some bonds are tied: oil loss will cause an export outage, which will reduce foreign exchange revenues, which may limit imports of drugs and capital machines, thereby exacerbating the economy's further performance.
Such a system description is useful because it prevents the accounting category from being confused with the actual relationship. "Aid 'may not be independent of market access;" investment' may not always increase domestic decision-making power; "low debt 'may not mean low vulnerability;" self-sufficiency' may not mean the ability to survive a single critical raw material failure. The name of the flow does not explain its function.
However, the same approach must not lead to new mythology. The network chart is not a complete economy. It does not in itself contain human dignity, legal responsibility or legitimacy of political decisions. It does not say who is historically right, who acted out of good intentions or what international borders are legally justified. It's how to ask questions for empirical data and historical documents. The concrete conclusion must be achieved before the sources and competing explanations, not before the aesthetic elegance of the diagram.
A locally advantageous decision can destabilise the system in the long term
TUS - INTERPRETATION. Many of the crises described here were made up of decisions that were reasonable to the individual player at the time of their adoption. The bank wanted to expand its loans quickly, the investor to achieve higher returns, the household to buy an apartment, the government to keep the exchange rate stable, the company to provide cheap energy input. The individual steps could be paid out under the given price conditions. However, the sum of these decisions could have created a system with short-term foreign liabilities and long-term domestic assets, dependent on uninterrupted refinancing. With a sudden change of confidence, local rationality has turned into a collective crisis.
Similar logic appeared in the investments made in Soviet agriculture and water management. The expansion of irrigation could increase local harvesting, employment and compliance with the production plan. However, the sum of all water withdrawals has damaged the hydrological balance of Lake Aral. Environmental externality has long been outside the accounting results of individual water users. The later costs were for fisheries, health, land and inhabitants who did not have the same choice of decision on the original investment plan.
This motive is not an argument against investment or market decision making. Is the argument for monitoring feedback and costs transferred to other actors or to the future. The historical economic balance is therefore intended to capture not only short-term production increases, but also maintenance, environmental burdens, debt, migration pressures and the ability to adapt operations to changed conditions.
Five verifiable hypotheses on sovereignty
To avoid a metaphor, systemic interpretation can be used to formulate several hypotheses that can support or refute time series and historical cases.
Hypothesis one - diversification. With similar productivity and financial situation, an economy with more independent customers, suppliers and transport routes should better resist the failure of one of them. The number of partners on paper is not sufficient to verify. The concentration of actual trade flows, the capacity of alternative routes and the costs of the reconnection should be measured.
Hypothesis two - quality of the commitment. Two countries with the same government debt-to-GDP ratio may vary dramatically in crisis resilience by currency, maturity, interest rates, refinancing conditions and domestic creditors' share. The test requires balance sheet data, not a single debt indicator.
Hypothesis three - institutional absorption. The same foreign capital can create a greater long-term contribution in a country with predictable law, functional education, infrastructure and capacity to support domestic suppliers. Convincing verification needs comparable investment projects and checking the initial differences between countries.
Hypothesis four - a hidden price dependency. The long-term energy input economy below the alternative price may show a higher profitability for some sectors than would correspond to their competitiveness in changing the price regime. The test should link invoiced prices, alternative achievable prices, transport costs, supply volumes and the ability to switch to other technologies.
Hypothesis five - Exits costs. The possibility of formally leaving the agreement may not mean real economic freedom if the immediate departure causes a power outage, payments, export or medication. The test would therefore monitor the time needed to restore critical functions after a change of partner. A system with strong dependence but a fast redirection option can behave more resiliently than a seemingly less interconnected economy with a single narrow throat.
The metric boundary. We're not going to pass any of the hypotheses on as confirmed just because they match some of the selected historical stories. Each requires the operation, appropriate control cases and publication of unsuccessful tests. Sometimes new ties can reduce geopolitical risk, but increase financial vulnerability. Other times, stricter common rules will limit one form of national freedom, while creating a wider opportunity to enforce contracts and trade. Openness and sovereignty are not simple contradictions.
Who's helping who? The answer is known by flow, time and the possibility to refuse
After the various historical cases, one cannot answer with a single sentence that the great powers "helped" or "always used the weaker." During World War II, the US Lend- Lise represented a real material contribution to the Soviet war effort. After the war, the Marshall Plan was also a renewal program, supporting American economic interests, and part of Western institutional architecture. Early Soviet economic relations with the defeated and dependent states included reparations, dismantling and unfavourable price relationships. At the same time, the later Soviet and Rvhpov systems created investment, energy links and large redistribution, but at the cost of significant restrictions on their own economic strategy in some countries and Republics.
The collapse of the USSR did not lift this problem, merely redesigned it. In some new countries, the choice of different rules and business partners has become available. At the same time, the links that financed schools, factories, energy and basic public services have broken down. Thus, the gain in legal independence could have co-existed with the loss of economic capacity in a short period of time. In other countries, integration into European institutions and production networks has started to increase productivity, export and access to finance, but has created new asymmetry of ownership and specialisation. Even these processes cannot be converted into a simple moral mark.
FINAL INTERPRETATION. It is not crucial whether the economy accepts aid, whether it is trading with stronger states or using foreign loans. What matters is what possibilities it gains through its binding and what it loses: whether it can negotiate a price, create its own production capabilities, change the rules, endure shock, seek alternatives and protect the basic life functions of the company. Sometimes a long-term commitment may be advantageous, which will reduce decision-making in the short term, but will significantly expand future capacity. Other times, a formal unconditional transfer may be part of a relationship whose hidden price will appear only when attempting to leave.
TUS - final definition. The network model here is not a tribunal of history. It serves as a tool for whether a company can recognise its critical dependencies, distinguish real aid from merely reappointing the undertaking and create feedback that allows timely correction. The point is not to eliminate interdependence - that would be economically and socially illusory. The purpose is to build relationships in which cooperation extends the possibilities of both parties and the price of leaving is not an unreasonable penalty.
This is the basis for an argument response. Verification of a particular state requires full and comparable annual series, knowledge of source revisions, debt structure and conflict breakdowns. Only their common reading will show whether the state has acquired a more resilient structure of bonds, or merely exchanged one dependence for another.