

This publication follows on from the Assistance, debt and sovereigntywhich monitors the external relations and the area of decision-making of the State. Here, attention is being drawn to the household: how economic structure, wages, prices, taxes and public services are reflected in people's time, income and real opportunities.
The text links historical series since the late 1980s with current data on wages, poverty, housing, debt and health care. Interactive graphs allow to change periods, household, country and indicator; for each chart, the sources and methodological limitations are given. The results of the models are separated from the statistics observed and from historical data taken from previous issues.
Chapter 1 · From state sovereignty to household
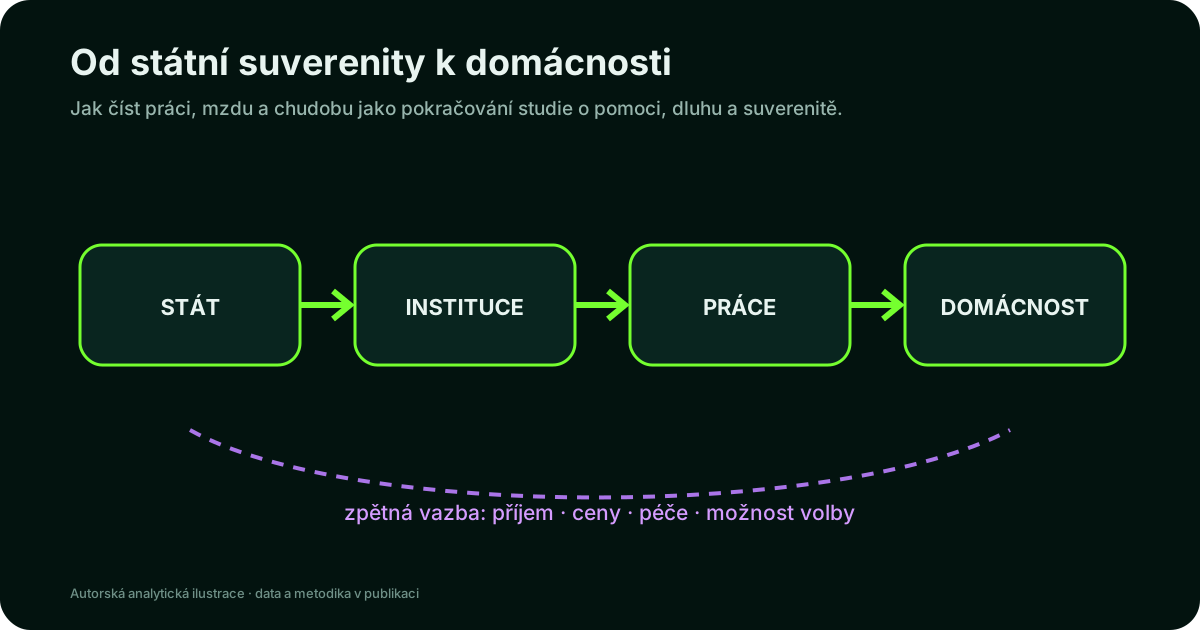
The sequel begins where the first book ended
Assistance, debt and sovereignty monitor how credit, investment, trade, monetary regime and institutional integration expand or reduce the possibilities of the state. This publication reverts the same question to the inside of the economy. It does not only ask whether the State can refuse a disadvantaged condition, but whether the disadvantaged work can be rejected by the person who feeds on it.
There is no direct line between the state balance and the family budget. The performance of the economy is translated into ownership wages, productivity, bargaining power, tax system, housing prices, public services and social transfers. Each institution may increase, weaken or shift some of the benefits to another actor. Therefore, economic sovereignty cannot be measured only by debt, by the balance of the budget or by the rate of growth.
Three layers which must not blend together
The first layer consists of the data observed: legal minimum wage, average and median wage, income threshold, price indices and share of persons burdened with housing costs. The second layer is made up of tax and benefit models, in particular OECD TaxBEN. The third layer is interpretation that links results with transformation, ownership and social policy. The book denotes each layer separately so that the derived number does not act as direct measurement.
The publication has twelve chapters in one coherent line of argument: from defining concepts to historical change and household models to the synthesis of economic sovereignty from the bottom.
From state balance to human time
In public debate, the success of the economy often shortens to several aggregates. If a product grows, if debt falls or investment comes to an end, it is to be a good result. These indicators are important but do not contain an answer to the distribution question. They do not say who owns the newly created assets, who is going to earn, what part of the value will turn into wages and how much paid and unpaid time the household has to spend to maintain normal life.
Time is therefore the second entity in this book. The amount on the payroll shall be converted into the number of hours required to achieve a certain income. This transfer has its limits: the hour of care is not the same as the hour of employment, and the OECD model hour is not the shift observed. Yet it allows a specific question to be asked where nominal amounts cover the differences between countries and household types.
What will the book consider evidence
The figure enters the argument only with the definition, unit, period and origin. The chart is a shortcut to the data, not a substitute. If two rows are not methodically overlapping, they will not be linked by a smooth line. If historical value is missing, there will be a gap. And if the result is calculated from several sources, the text will refer to it as a derivative instead of issuing it as a direct statistical observation.
This is an important process for poverty. The difference between 50% and 60% of the median is not a graphic detail, but a different line. Gross minimum wage is not available. The national poverty limit in the US is not interchangeable with the European relative threshold. The accuracy of the book is therefore not created by the number of decimal places, but by a consistent separation of these categories.
State debt converted into inhabitants
The conversion of government debt into one population converts a large budget figure into a more understandable standard. However, it is not a citizen's personal account or the amount payable by each person. The State refinances the debt, pays interest and covers it with future revenue; at the same time it holds the assets and finances services and investments. The right question is, therefore, how debt changes, the costs of its service, productive capacity and tax base, not "how much is due after birth."
State debt per capita 1993-2025
Annual state debt divided by population to 1. January. This is a derived indicator, not a personal liability of the population.
Source: Ministry of Finance: Structure and evolution of government debt · Eurostat demo _ panan · CSV graph data
Curve overlay: debt and wages on a common index
To find the match, you can switch on more rows at once. Each is converted into a common basis of the selected year = 100, so the graph compares the pace of change, not the incomparable crown amount. The overlap can show correlation over time, but it does not prove itself that the growth of one variable has caused the growth of another. Both can respond to inflation, economic cycle, demography or policy change.
External calculators, for example Czech State debt, may, in an indicative manner, interpolate the amount between the published points. This publication instead of the inserted banner uses its own reproducible graph from the official series of the Ministry of Finance and the Eurostat population. It avoids the unsecured HTTP element and the impression that movement every second represents the transaction that is measured.
The amount of debt is not enough: it depends on its structure
The same total debt may create different risks by currency, maturity, interest rate and creditor heading. Domestic financing usually reduces direct exchange rate risk and can underpin demand for bonds on the domestic financial sector. At the same time, the state is more closely linked to the balance sheets of local banks, funds and insurance companies. Foreign financing extends the range of investors, but according to currency and contractual terms, it may add exchange rate, legal or refinancing risk.
The division into domestic and foreign debt is therefore not a ranking of good and bad debt. It is the first map of addiction, followed by the first book by the question of who can change the conditions and what the alternatives are. The chart shows the crown value of both components; their risk is still determined by maturity, rate and currency.
Domestic and foreign component of government debt
The slider shows the structure of the crown value of debt in each year. The vertical axis is fixed from 0 to 4,000 billion. CZK for a whole range, so column height can be compared directly between years. The sum of both columns corresponds to the total debt.
Source: Ministry of Finance: Structure and evolution of government debt · CSV graph data
Comparison of data discussed in this section
Choose two rows and a year. The value of 100 is 2005; the graph therefore compares the rate of change, not the debt situation with one month's wage.
Source: Ministry of Finance · Eurostat · Czech Republic / MPSV; local audited series. The missing figure is not shown as zero.
Chapter 2 · What measures income poverty
Relative boundary describes the position within the company
The median boundary changes with income distribution. When income grows in the middle of a division, the threshold grows. When the revenues of society fall in crisis, relative boundaries may fall, even though material life has not improved. This apparent paradox is not an error of the indicator. It recalls that relative poverty measures the possibility of participating in the life of a given society, not the biological minimum equivalent for all countries and times.
That's why the book uses several additional views. The income threshold captures the position, the HICP price change, the excessive burden of housing the pressure of specific expenditure and the TaxBEN institutional transfer of work to the disposable income. None of these indicators is "right" in itself. Each lighting up a different mechanism and their contradictions are analytically useful.
Why is the household unit
Income is earned individually, but a large part of consumption and care is shared. The rent, heating or internet connection is not increased linearly with each other. Food, transport, clothing and care times are growing, with children's number and age. The equivalent income is an attempt to convert these differences into a common scale. It's a statistical tool, not a claim that all households of the same type have the same needs.
The increase in wages does not yet guarantee that work will feed the household
In 2013, according to the OECD model, a Czech parent who himself had raised two children, approximately 79 hours work per weekto cross the chosen relative poverty line. The figure has become a symbol of the paradox of the modern economy: society may show growth in production and employment, yet one fully paid workforce may not be enough to secure family income.
The OECD publication was published in 2015, but its chart values refer to 2013. The only thing that matters is the gross wage. The resulting household income also affects the number of working members, labour taxation, compulsory contributions, children's tax advantages and social transfers. The same hourly minimum may mean a very different number of hours in different countries to cross the same type of relative boundary.
The salary determines the price of the work on the payroll. Only the sum of the household's net income will show whether the household will remain below the income poverty threshold.
The calculation of the time needed to overcome poverty is therefore also a test of economic adjustment. It shows who needs one salary, when the need for a second earnings is created and how much family time society actually turns into paid work. However, this is not a direct test of living standards: two people just above the domestic relative threshold may have a very different life in absolute prices and housing conditions.
The poverty line is based on the median Net household income
The European indicator of income poverty sets the threshold at 60% of national median of the equidistant disposable household income After social transfers. The median divides the population in two halves. The equalisation takes into account that two adults and two children need more money than an individual, but they share some of the expenditure. The disposable income includes the result of taxes and social transfers. This is not 60% of the average wage, 60% of the gross salary, or the normative minimum life basket.
The so-called "European approach 'is used modified OECD scale: first adult is 1, next adult is 0.5, child under 14 years 0.3. The individual thus multiplies the baseline by 1; the single parent with two younger children 1,6; the couple with two younger children 2.1. If a child is at least 14 years old, the weight of this scale shall be 0,5. The age limit used changes the result substantially.
Why not compare simple averages
The average gross salary is useful for monitoring the total wage level and distribution of the product work. In a high-income economy, the average may lie well above the wage of most employees. The median gross wage therefore better describes the "middle 'employee.
Czech structural inquiry for the whole year 2025 states median 44 337 CZK Gross monthly; year-round average was 49 215 CZK. These two figures have different methodologies and are not interchangeable. Both are the wages of an individual worker, not the equivalent of the household income.
Why 50% and 60% separate
The OECD normally uses the 50% median limit; Eurostat for the 60% standard European indicator. Both thresholds can be shown as alternatives to the same income distribution. If you exceed 50%, you don't have to exceed 60%.
The international ranking may only include cases with comparable thresholds, idiovalidation, households and a tax-benefit model. The historical figure of around 79 hours for 2013 therefore does not form a directly linked time series with the newly modelled result. The difference between the published OECD 2015 result and the current output for the same model case is an open audit problem. General information that the model can be updated back does not explain in itself a specific change from approximately 79 to 50 hours.
In calculating the "hours of work ', it also depends on whether they are continuous employment, part-time work, overtime or coexistence of employment contracts. The net wage is not always increased linearly with the number of hours: tax rebates, minimum assessment bases and social benefits can create breakdowns and sometimes traps. An annual version of the country's tax-benefit system is required for a precise conversion.
Czech Republic 2013: published at 79 hours and today at 50
The OECD's 2015 OECD Chart 5 lists for single-sector individuals with two children approximately 79 hours per week at minimum wage and a limit of 50% of the median net income. The current TaxBEN output for the same model household type gives 50 hours. This is the difference between two model outputs, not direct measurement of the actual working time.
| Model household, 2013 | Today's output without both doses |
|---|---|
| Individual without children | 52 h per week |
| Single with two children | 50 h per week |
| A couple without kids | 74 h per week |
| Couple with two kids | 65 h per week |
Czech Republic 2013: switching doses does not change the result shown
| Housing allowance | Temporary allowance on taking up work | Result |
|---|---|---|
| Yes | Yes | 50 h per week |
| Yes | No. | 50 h per week |
| No. | Yes | 50 h per week |
| No. | No. | 50 h per week |
It's not just this one country and a year. The OECD TaxBEN export control for GMIWHEPJF included 10 544 complete combinations of country, year, wage, type and age of children in a model household in 43 countries in the years 2001- 2025. In 1,715 scenarios, the turn on or off of the temporary dose on taking up work reflected into at least one result displayed; in 8,829 scenarios the hours displayed remained the same. The change in the housing allowance was reflected in 5,753 scenarios. In Czech data, the temporary dose was not shown in any of the 300 complete scenarios of this panel - all available years, household types, wage variants and age combinations of children. These figures describe the OECD output table after its publication, rounding it to hours; they do not explain why these models occur. In the real budget, the available income may change, so the switch cannot be considered as a "no-dose" scenario without further consideration.
Why is it important: the zero effect in the Czech panel may be related to the definition of the indicator, to the limitation of the scenario, to rounding, to the mapping of the dimension or to the calculation. These are the possibilities for verification, not a confirmed explanation. In particular, the unrounded intermediate results should be checked. The difference of 79 / 50 and the extent of the zero switch effect therefore remain open to audit issues. To decide, we need archival run from 2015, precise entry rules and parameters, code versions, intercalculations and changelogue.
OECD export control carried out 22. 10. 2026; we count the change between the switched on and off option in each available combination of four switches and report the displayed for hours. Sources: OECD (2015), Figure 5; OECD TaxBEN Methods and Manual; OECD definition of indicator; OECD TaxBEN source dataset. Download Table Czech Republic 2013 · Summary of cross-country and years.
Comparison of data discussed in this section
Compare household types and switch between 50% and 60% of median. The amounts are the monthly limits of net equivalent income, not gross wages.
Source: CSU, EU-SILC; derivation by modified OECD scale. The missing figure is not shown as zero.
Chapter 3 · Before breaking: work and security 1985- 1991
The historical beginning is not an extension of today's table
1985 provides a useful start for a long series, but not a single institutional base. The Czechoslovak economy before 1990 did not have the same labour market, price system or batch system as the Czech Republic today. Formal full employment, regulated prices and corporate social functions shifted part of the cost of living away from the payroll. A direct division of the historical wage today's poverty line would therefore create an accurate figure without precise meaning.
We read the historical part as a change in the collateral regime: what guaranteed the business, what guaranteed the state, what the household and what was hidden in the shortages, waiting lists or non-monetary benefits. Where the source allows only macroeconomic comparisons, we will not derive from it a net family budget.
Full employment did not exclude other forms of restriction
The late socialist regime combined the right and the duty to work with the large-scale role of housing, recreation and social security enterprises. Low open unemployment therefore represented real certainty, but at the same time there was a limited choice of employer, wage nivulation, hidden overemployment and politically conditional access to certain professions. The only total employed cannot appreciate these characteristics with a common sign.
Prices also had different information content. The regulated price could have kept the basic farm available for nominal, while the lack manifested itself by waiting, informal exchange or impossibility to buy the required quality. Therefore, when comparing back-to-back, it is necessary to monitor the money together with availability. Otherwise, the non-monetary restriction would have disappeared and current monetary poverty would have been mechanically reflected into a different system.
What was achievable between 1985- 1989
The memory of the house, the cottage, the car and the business vacation captures a real part of the life at the time, but does not determine how easily the typical household has come to these goods. The family house was often created by self-help, with long work related to it, limited material selection and land allocation. The cottage could be an older family property or an adapted building. Recreation has been discounted by businesses and ROH. The cash price therefore only captures one part of the cargo.
Car is a good control of too simple image cheap past. The period price list Mototechny lists in 1988 the damage 120 L for 65 630 Kcs. At the average monthly wage of 3,095, which was about 21,2 gross monthly wages before any life expenses. This added waiting and limited supply. The car was expanded, but the new car was not cheap consumer goods.
Statistics on family accounts indicate that the working house spent 7.4% of its housing and transport expenditure in 1989. The low monetary share of housing is indicative of regulated costs; it does not appreciate the queue for the apartment, its self-help structure or quality and location. The historical chapter therefore leaves a double account: money and non-monetary obstacles.
The expansion of recreational property confirms the census of March 1991: it captured 268 040 individual recreation objects and 128 387 undivided chalets, altogether 396 427 objects or 10,7 per 100 residential households. This proves that the chatarship was not marginal. This does not say, however, that every household could easily buy a new cottage in 1989; the inventory mixes older property, adapted cottages and new recreational buildings.
| Period | What can be documented | What does a number not say |
|---|---|---|
| 1985–1989 | The new Skoda 120 L cost about 21,2 gross wages in 1988. The housing account for 7.4% of the expenses of the worker's household in 1989. The 1991 inventory registered 396 427 recreational buildings, 10.7 per 100 residential homes. | He does not appreciate waiting list, self-help, lack of material, family work or whether the cottage was inherited, adapted or newly purchased. |
| 1995 | The average gross wage of CZK 8 172 is the reference denominator. Comparable asset prices still require a period table. | Without the price of the same type of house, cottages and cars, one ratio of availability cannot be created honestly. |
| 2005 | Cost of a new apartment in a family house 2,7425 miles. CZK was about 149.5 of the average gross wage at the time. | This is a new construction, not the average price of all houses or the necessary cash without a mortgage. |
| 2015 | 32.4% of people said that the household cannot afford a week off. | The indicator does not measure the quality or the target of the holiday and does not determine whether the household has actually left. |
| 2025 | The average price of the family house was 56 066 CZK / m ². The week of vacation could not afford 19.0% of people, but 55.7% of people below the income threshold. | The national average of the house price is not the price of a particular property and must not be mixed with the regional rankings. |
Working data matrix: Download CSV. Historical gaps are deliberately visible.
Fountains: CSU: Mr. Average Buys · CSU: history of family accounts · Addition of recreational objects 1991 · ČSU: prices of real estate 2023-2025.
Before transformation: minimum wage, other institutions, other options
To understand the current position of low-income households, it is not enough to start in 2001, when our longest internationally comparable OECD model series is starting to run. The second half of the 1980s already knew the differences between economies with similar levels of industrial development, but with different labour law institutions and public support systems. Direct historical data for 1985 are therefore not a turning point: they help to explain whether low wages remained close to or away from other employees' incomes.
Minimum for median: the ratio shows the position of the employee, not the cost of life
In 1985, the legal minimum in Australia was approximately 64,6% median wage, in Canada 39,3 %, in the United States 38,4 % and Japan 31,1 %. All four values are from the OECD comparative series. They do not describe purchasing power or housing costs: the same share of the median minimum may mean a completely different consumer budget in different countries.
The development of minimum earnings is only part of the story. A higher share of the median can improve people's position at the bottom end of the wage distribution; however, it may not correspond to lower taxes, higher doses or lower housing prices. This is why the relative wage indicator needs to be accompanied by a model of net income for the family and, on its own, by real living costs.
Czechoslovakia and 1991: beginning of another statistical series
The Czechoslovak socialist pay system did not know the legal minimum wage in today's importance, which could be put in an international table with the US or Canada. The tariff scales, social housing and services, the prices and operation of the undertakings affected by the State were different. The Federal minimum wage was only created in 1991; therefore, the older period cannot be reproducibly drawn by one artificially defined number.
The period growth of nominal Czechoslovak wages must be planted in the price system. The liberalisation of prices in 1991 changed the importance of nominal payments very quickly, while the division of assets, household expenditure and working security gradually took place. The pay of 1989, the pay of 1991 and the salary of 2025 are not three values that would be sufficient to convert the current rate into one table. The conversion of the currency will not be able to capture the availability of housing, consumer products, services, family support or the extent of subsidies.
For the Czech and Slovak parts of the Federation, the historical series will therefore work explicitly with the label Czechoslovakia where the source is following the Federation, and with the Czech or Slovak economy only for data that actually allow such a distribution. The difference between pre-transformation and transformation statistics remains visible in graphs.
USA: what the period of poverty is saying
The US federal minimum allows a simple rough calculation to be reconstructed for 1985. According to the historical poverty limits, the Census Bureau was based on one person in 1985, approximately 32 hours work per week, for one parent with two children approximately 50 hours and for a family of four with one earnings approximately 63 hours. In 1991, they were based on the same calculation for about 33, 51 and 64 hours. The source is the national pre-tax threshold and the average federal minimum of the year.
Historical statistics also require independent work with the period definition of poverty, Canada, Japan and other countries. For example, the Canadian share of people under the income cutoff is not in itself an amount that can be divided by a minimum hourly wage; for calculation, the income threshold of the household type and year is needed. The accuracy of the comparison therefore lies in which we refuse to replace the missing values with assumptions.
Comparison of data discussed in this section
The comparison shows the status of the legal minimum against the median or average gross wage in the years 1985- 1991. The gaps remain empty.
Source: OECD MIN2AVE; historical layer 1985- 1991. The missing figure is not shown as zero.
Chapter 4 · Transformation of work 1991- 2004
The transformation has changed more than ownership interests
At the same time, the valuation of labour, price structure, employment, taxes, benefits and ownership of enterprises changed after 1991. One timeline therefore contains several different processes. Privatization could increase the productivity of the company, while job losses reduced the income of a particular household. The opening of the market could have expanded the supply of goods, but at the same time transferred the previously regulated costs to the money budget.
The purpose of the chapter is not to attribute the whole period to a single mechanism. It monitors which institutions have transferred productivity into labour income and how the legal minimum gap from the typical wage has changed.
The new labour market has divided the risks in another way
The company in the planned economy carried part of the social functions that, after the transformation, moved to the state, the municipality, the market or the household. At the same time, unemployment was created as an openly measured phenomenon, and wages began to respond more to the productivity of a particular firm, region and professional demand. The change created new opportunities, but also new differences in who carries the cost of restructuring.
The link with the Western European industry has brought capital, technology and sales. From the perspective of the first book, it expanded production capacity while creating new links of dependence. In terms of this book, it is crucial whether higher productivity has been reflected in wages across division, or in particular in profits, reinvestment and income of more qualified groups.
A great distance between the minimum wage and the salary actually received
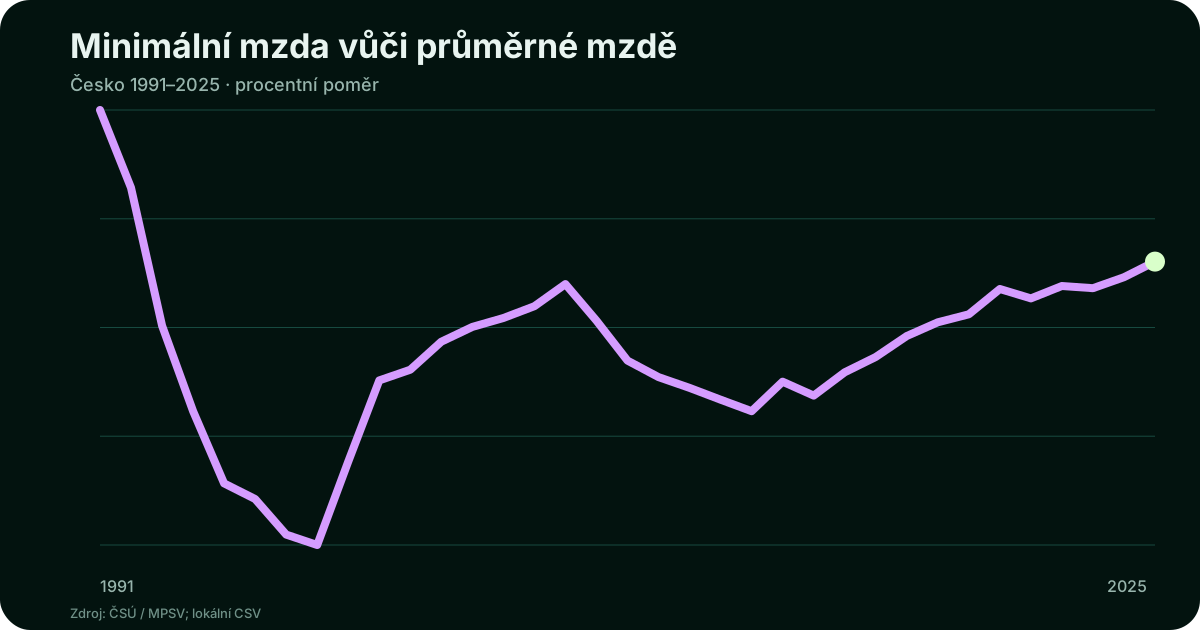
After the introduction of the legal minimum in 1991, the Czech economy underwent price liberalisation, privatisation, the creation of a separate state, industrial restructuring and accession to the European Union. Average gross wages have grown over the long term, but the minimum wage has not gone through the same trajectory. Its real purchasing power and relationship to typical earnings have changed employers' motivation and workers' negotiating power.
The development of minimum wage is therefore not just a technical item in wage legislation. In years when the legal minimum has not changed for a long time, the lower part of the wage distribution could have been further away from average even when the product per capita grew. In years of faster growth, this relative gap could have diminished without showing the appropriate growth of the clean living standards of children's households.
Czech Gross Wages at Time
Minimum monthly wage valid at 31. December and annual average gross wage; both in the ordinary CZK. Average wages from 1991- 2023 are from the marked historical secondary source compilation.
Czech border of 60% of the median changes with income in society
The relative boundaries of poverty are moving over time. It is not once and for all a fixed amount. When available income grows in the middle of a division, borders also grow. Therefore, the economy can double nominal earnings while maintaining a significant part of relative income inequality.
Czech income poverty limits · EU-SILC 2018- 2025
The poverty line needs to be seen here from the perspective of the time-reference period. The EU-SILC investigation carried out in 2025 is based on the income indicators of the year 2024. If we want to find out if a staff member with a specific salary of 2025 would have exceeded this threshold, this is a comparison with the last published threshold, not an accurate common reference year. In an accurate historical model, wages, taxes, levies and measured revenues must be aligned in time.
Average and median can describe significantly different earnings
In a single year of the structural inquiry for 2025, the difference is particularly apparent for the management and professional professions. The average wage in the table is higher than the median because it increases very high earnings. Therefore, working hours for "average wages" are not typical hours of a staff member.
CSU, Staff wage structure 2025, gross monthly wages. The national average of CZK 52 202 is from the same structural statistics as the median of CZK 44 337; it is not the average of the company's reporting.
Three different stages of the Czech labour market
Transformation of the 1990s combine a rapid change in relative prices, ownership and employment with the emergence of new professional and regional wage differences. The time comparison with 1991 must be made to remember that the Czech crown, the structure of businesses and international classification had only stabilised at the time. The higher average wage alone does not reveal who benefited from growth and how many workers remained at lower wage levels.
Growth and European integration period has strengthened the export sector after 2000. The productivity of many businesses has increased, but it is crucial for the household to see how the added value is distributed between profit, wages and levies and how the state combines the work income with family support. One parent's employment may be more important for the family balance than the average wage growth across the economy.
Period after 2019 brought a pandemic, severe price shocks, and a subsequent wage response. The growth of nominal gross wages at the same time may not mean the growth of real disposable income. However, here we focus on the income threshold, not on housing, food or energy prices; these require a separate comparison of living costs.
Comparison of data discussed in this section
Two crown rows can be read alongside each other in one year and in time. The spread shows a change in the lower limit of the average, not the distribution of wages within the population.
Source: CSU / MPSV; local audited time series. The missing figure is not shown as zero.
Chapter 5 · Czech Republic 2004-2025: wages and minimum
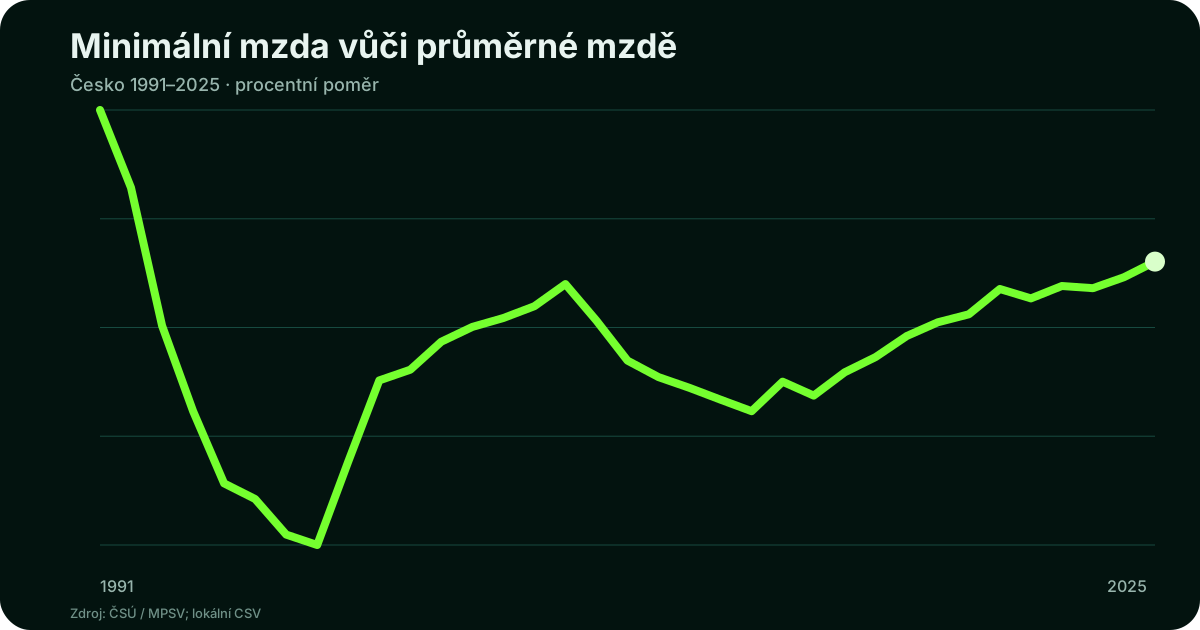
Czech Series as a Relationship, not a Nominal Amount Competition
The minimum wage has increased many times between 1991 and 2025. This fact does not say itself whether the position of low-paid work has been strengthened. For long-term reading, the minimum share of the average and median, net income after deduction and relation to the specific household boundary are important.
Minimum fills several roles simultaneously
The legal minimum wage is the wage floor, the political signal and the parameter of the rules. Its increase may directly increase the remuneration of a part of the staff and indirectly shift the tariffs just above it. The effect depends on the recovery, coverage, inflation, productivity and ability of employers to reflect change in prices, margins or employment. A simple "higher minimum" dispute helps "against" higher lower harm "therefore precede the institutional context.
The share of the minimum on average wage is useful for a long line, but the average increases high earnings. The median share is better indicated by the distance from the typical employee. This ratio does not, however, include the length of the period of time, the tax, the benefits and the number of dependants. Therefore, the following parts go from wage rate to household.
Minimum wage against average 1991- 2025
Follow the change of wage floor with the slider or automatic playback.
Source: CSU / MPSV; local audited series · CSV graph data
Indicative Czech calculation without full dose simulation
The following calculator converts monthly gross minimum, median or average wage into approximate net income using parameters of Czech wage and taxes in 2025. It takes into account employee social and health insurance, the basic discount on the taxpayer and the tax advantage on the first two children, including the monthly bonus. The EU-SILC 2025, with the year 2024, remains the basis of the poverty threshold. For the median and diameter variants we use the same structural investigation of the Czech Republic (44 337 CZK and 52 202 CZK). Another number of CZK 49 215 in the historical chart represents the average of the company's reporting and must not be confused with the structural average.
The Commission shall, by means of implementing acts, adopt implementing acts laying down the rules for the application of this Regulation.
How many weekly hours would the first worker need if the household has no other salary? When compared, the selected income limit remains the same as in the calculator above. The number of hours only covers the abovementioned indicative taxation of wages, not social benefits or housing costs. The conversion over 40 hours is a mathematical, not recommended mode of work.
The results are an approximate model of net wages in 2025 and the EU-SILC 2025 (income 2024). Their purpose is to show separately the impact of the level of wages and the number of dependants. This is not about continuing the official OECD series.
The model does not charge housing allowance, child allowance or additional benefits and does not provide for special discounts. It does not consider receiving a benefit depending on hours worked, overtime, additional payments, employment on DPP / DPC or annual settlement. For short periods, health benefits may include a supplement to the minimum assessment base. Results over 40 hours are mathematical equivalent of earnings at the unchanged rate, not on a recommendation or realistic working schedule. The calculator is therefore not identical reproduction full OECD TaxBEN model.
The first profit of a regular employee in the Czech tax system does not tell the whole story. A tax bonus per child can change the net wage compared to a childless worker by thousands of crowns if the legal conditions are met. On the other hand, no tax bonus alone guarantees that only one member of a four-member household will exceed the 60% income threshold. This shows the importance of combining wage levels and institutional support for the family.
Why was Czech value so high?
The OECD 2013 chart measured the number of hours a single parent with two children would need to work for a minimum wage to exceed the relative threshold defined by: 50% median. For the Czech Republic, it stated 79 hours, while many European countries reached lower levels. Differences were created by combining the minimum wage level with normal income, taxes and benefits for a defined household type. The purely mechanical ratio of gross wages and income poverty limits will not replace this chart. The comparison of the period version of the graph with the later OECD revisions is not directly evidence of improvement or deterioration without verification of the individual parameters.
How many hours for minimum wage · OECD 2013
Lone parent, two children; 50% median, published by the OECD in 2015. Roundabout values rewritten from a shared historical chart.
Special cases with or without work or with the specific availability of a statutory minimum cannot be interpreted as a simple multiple of the hourly wage. This is a model value in a specific institutional situation, not a measurement of the actual hours worked by households.
The Czech 79 hours in this comparison is a historical fact about specific methodologynot proof that the Czech employee had to work 79 hours a week on average to survive. Some of the population received wages above the minimum, some of the households had two earnings and some had additional income. The chart isolates a specific but socially important case: parents with two children dependent on the lowest legal pay for work.
The difference between such a situation and the result of a childless individual shows the important dimension of the welfare state. Institutions can support employment, but can also create a situation where a parent's return to work does not generate sufficient net income. The assessment of the change over the years requires the same OECD TaxBEN parameters for each year. A simple combination of the historical graph and today's gross earnings would create a seemingly undocumented trend.
Comparison of data discussed in this section
The model holds the same year, minimum wage and simplified Czech taxation. The household type and income limits are changing; neither the housing benefits nor the full dose system are accounted for.
Source: Self-transparent payroll model of the Czech Republic 2025. The missing figure is not shown as zero.
Chapter 6 · Income not distributed evenly
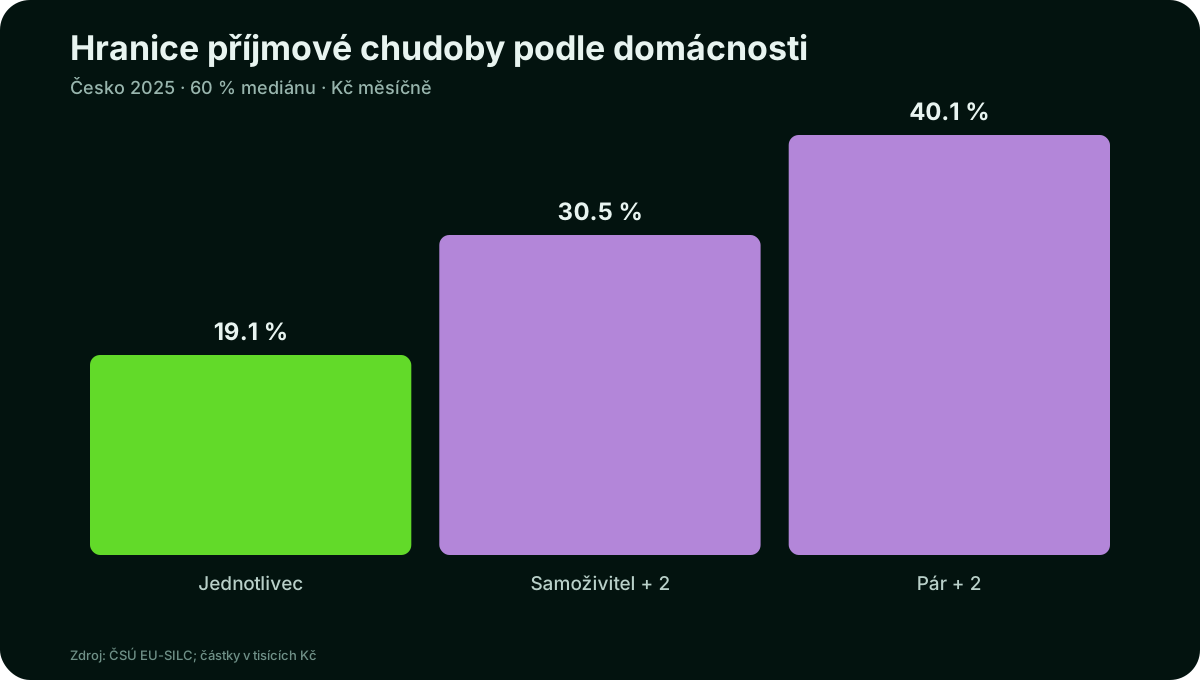
The equivalence scale is an analytical transfer, not a family account
Statistics do not give every other member of the household the full income of the individual. Shared housing and equipment create economies of scale, but children also change the need for care and affordable working time. The equivalence coefficient allows for comparison, but does not describe actual rent, kindergarten, transport or health needs of a particular family.
First, the distribution of income for the whole Republic
The national average is useful for the aggregate volume of income, but does not describe a typical household. The median lies in the middle of the division and the income fifth shows what part of all the equidistant disposable income will receive every 20% of the population. We use the whole Czech Republic; we do not mix regional price and wage differences in this graph.
In 2025, the lower fifth was 10,3% and the upper fifth was 34,5% of the national ITIs. S80 / S20 was 3.34. The annual median of the available income was CZK 381 800 and CZK 420 373. This is not a gross wage for an employee: the unit is the income of a person after the conversion of the share of household resources.
How to split national income
Each column is the proportion of one fifth of the population in the national equivalent disposable income.
Source: Eurostat lic _ di01 · CSV graph data
Households by tenth of the income distribution
The CSU allows a second view directly through the household. Each tenth of the household consists of approximately the same number of households, classified according to net cash income per modified OECD consumer unit. In 2024 the average was CZK 181 318 per year in the lowest decimals, while CZK 887 751 per year in the highest. The difference is almost five times that. The composition of the groups varies however: the household accounted for an average of 0.43 workers in the lowest decimals, at the highest of 1.74. So the graph does not compare ten identical families with different payouts.
Net household income by decimals
The slider passes through ten equal groups of households from the lowest to the highest income; the annual income per modified consumption unit is displayed.
Source: CSU: Income and living conditions of households 2025, Table 3a · CSV graph data
The same gross wage does not generate the same disposable income
An individual without children, a single and a couple with two children is not only different in number of people. They differ in tax rebates, benefits, care distribution options and the number of adults who can increase working time. For a couple with one worker, there is a potential second income, but achieving it may require an affordable kindergarten, transport or flexible working hours. A model that does not mention these conditions would confuse the formal possibility for real.
The individual faces a special time limit. Another hour of work can increase the earnings, but at the same time cause a load of care and transport or reduce the dose. The effective return on the additional hour is therefore not the same as the gross hourly rate. A quality system minimises sharp breaks, with low wage growth leading to a large loss of support.
The border is not a safety cushion
Crossing the statistical threshold by a small amount does not mean that an unexpected expenditure is to be paid. The household can be above the threshold and yet not have a bail reserve, a repair car or a disease. The book therefore understands the border as the first checkpoint. A fuller picture also needs to be monitored by material deprivation, housing, debt and income stability.
One profit, two children: the same money, three borders
A man living alone must cross the border for one consumer unit. However, a single with two small children needs a net family income of at least 1.6 times according to the modified OECD scale. For a couple with two children, the limit is 2.1 times. The increase in the threshold does not say that the child consumes exactly 30% of adult spending; it is a statistical retrovalidation convention for household comparisons.
It is the household composition that explains why average wages are not a universal response to the issue of poverty. One worker can have a certain net income; the single worker can stay below the border with the same income and the couple raising two children can get over the border with the second earnings. The tax advantages on children change this picture and in some cases the net income may increase substantially.
It is therefore worth comparing two situations for a couple's family: one working parent and both parents at work. The time spent caring for young children is not equally divided in both modes. However, crossing the statistical threshold at two earnings does not yet tell us about the cost of care or how the family manages the work schedule.
Comparison of data discussed in this section
Select two income fifths. The columns compare their share of national income in the same year; the time view shows whether the distribution is changing.
Source: Eurostat ilc _ di01; national income distribution. The missing figure is not shown as zero.
Chapter 7 · OECD TaxBEN: how many hours is enough
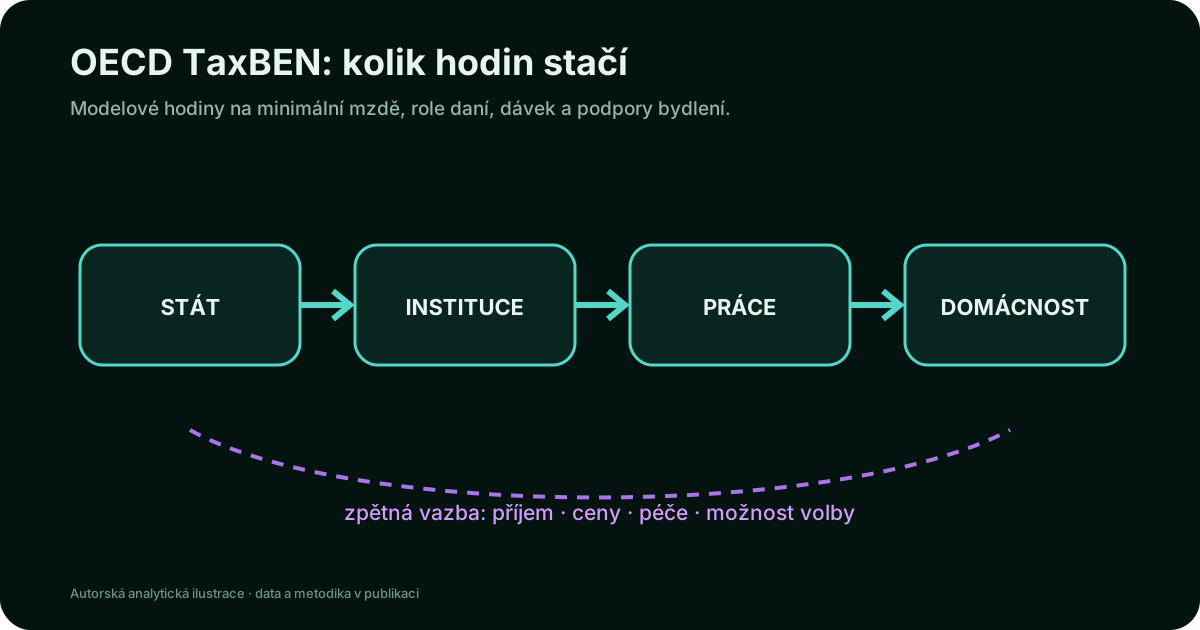
TaxBEN is a controlled experiment with institutions
The OECD model holds the selected household characteristics constant and changes the country, year, work income and the presence of certain benefits. Its strength is to show a common result of wages, taxes and transfers. The weakness is precisely the model nature: it is not the average of hours actually worked or the recommended working regime.
The result is a common product of wages and institutions
If the country reaches the low number of hours required, it can be a high minimum wage, low tax on low income, family benefits, housing promotion or combinations of income. The same number may therefore hide a different allocation of costs between employers and the public budget. For political interpretation, it is necessary to analyse the mechanism, not simply to sort the results.
The value of zero is of special importance in the model: the entered household will cross the border at non-working income and modelled transfers. On the contrary, the value on the top edge of the model may not mean a precisely achievable working week. Both cases require reading methodology and must not be converted into a simple moral court on the workmanship or generosity of the system.
How many hours at minimum wage does the family get above the poverty line?
One working person, three household forms and the same question every year: how long must a person work for a legal minimum to exceed his household according to the OECD TaxBEN model 50% of the national median of available income? This is not a gross profit divided by the poverty line. The model considers taxes, contributions and entitlement to the specified benefits. The result is the number of hours per week necessary for a particular model household. In addition to the weekly value, we add its calendar equivalent to the average month: weekly hours × 52 / 12.
How many hours of work does minimum wage mean?
Same conditions, different states
The order is set up at the top for the year; the country without published data is omitted. The international comparison also reflects, in addition to the minimum, differences in benefits and taxation.
Source: OECD, Working hours needed to exit power. The value 0 may mean crossing the border no longer without working in the model; 80 may be limited by the upper limit of the model. The monthly equivalent is our arithmetic calculation. The housing levy does not mean an identical amount in all countries. Data file: OECD CSV (original standardised series).
The lower the minimum is compared to the median wage, the more difficult one low salary is
Minimum and median wages are wages of individual workers; the poverty limit above is, on the other hand, based on the net income of the whole household. We can't confuse these two variables. Yet their long-term comparison shows well the changes in remuneration for the worst paid work.
OECD MIN2AVE contains comparable legal minimum ratios to the full-time gross wage of employees. Source: OECD Data Explorer (MIN2AVE, own local archive 2026-10-19).
Czech Republic: income limit 50% and 60% in crowns
The European 60% median limit is more stringent than the 50% definition used for the OECD hourly model. For the Czech Republic, both borders and three types of households can be monitored from official Eurostat data. But this does not mean that we can derive the necessary hours for 60% from the number of OECD hours at 50% just by multiplying.
Source is Eurostat lic _ li01, thresholds expressed in national currency. For single users, the threshold is derived from the threshold of the individual by an equivalent coefficient of 1,6 for two children under 14 years of age; this is derivednot a separately published value. The year on the axis is the year of the investigation and may refer to the previous year of income.
If household money is really enough for housing, food and ordinary life, it cannot be read from a single relative threshold. Two economies can have similar "hours to poverty," yet different costs of rent, energy, transport and childcare. Such analysis must be based on direct household and housing expenditure data. The boundaries of poverty and the minimum consumer budget are not synonymous.
Why can economies with similar productivity differ in working hours?
The minimum wage is a political-economic outcome. It is formalised by the structure of employers, trade union strength, labour law, competition, living costs and economic policy preferences. The minimum indexation rules also have meaning. A country with higher productivity may have a low minimum wage relative to the median; a country with lower productivity may protect the lower part of the income distribution relatively more strongly.
Breakdown of value between work and capital
Two factories can produce the same product, but they are located at opposite ends of the value chain. One development, brand and distribution; the other provides part of the assembly. The value created, the space for wages and the economic power in negotiations may then vary, even if the final products leave the production hall at a comparable rate. Higher exports may not in itself mean corresponding higher wages.
Social State and Labour are not contradictions
Tax rebates on children, transfers and the public service available may change the necessary amount of paid work of parents. Net income is essential for the calculation of relative income poverty; however, free education or health care is generally not directly attributed to it in the full value of the service. Therefore, two things can be said about the fiscal system at the same time: it increases the financial availability of basic needs for certain families, while it is more important for the family income threshold than the gross wage itself.
Transformations in post-communist countries
After 1991, the Czech Republic, Slovakia, Poland and Hungary did not enter the world economy under the same conditions. They have inherited a different industrial structure, various external commitments and an unequal level of agriculture, engineering or services. The different pace of privatisation, investment, exchange rate regimes and access to Western markets changed where added value was created and who had sufficient bargaining power to convert it into labour income.
Therefore, GDP per capita growth alone is not a sufficient indicator. For the issue of poverty, we are interested in how much of the newly created value will be achieved by low and medium-earners, what are the net incomes of particular households and whether the resulting social security is sustainable even during economic crises.
How many hours of work for minimum wage does a family need to escape income poverty?
We can look at the European minimum relatively to the median wage, but this does not explain the situation of the household itself. The money that remains after tax and transfers is crucial. The OECD TaxBEN model therefore simulates a family receiving guaranteed minimum income benefits and seeks weekly working hours where its available income exceeds 50% of the national median. For comparison, we choose the legal minimum wage, no temporary benefits on taking up employment and separately detachable housing support.
Same rate, very different experience
In the model without a housing allowance for 2025, the Czech individual needs minimum wage 42 hours a week, while a single with two children 62 hours and a four-person household with a single worker 75 hours. There are adequate results in the US 59, 80 and 80 hours. The Australian model presents 30, 19 and 30 hours. Australia's result in a single individual is not a recalculation error, but a reason to follow a specific dosage regime in addition to the salary: social transfers and their reductions change with the number of hours worked.
A high number is not recommended to work for such a time: it expresses a modelled point of exceeding the statistical threshold. Value 80 hours is repeatedly present in OECD extracts and requires caution in interpreting the top range of the model; it cannot be automatically confused as a legal working regime even without further documentation as an unlimited exact requirement.
The Japanese series in our comparable selection ends in the year 2024. The new data must therefore not be automatically transmitted until 2025. The Czech and American series for this scenario 2025 is available; the marked gaps are not zeros. On the contrary, zero in the model means that the household's modelled income will cross the border even without working hours, under the assumption of benefits.
Why does a single person ever come out better than an individual?
The overview cannot be read only as a wage-rate competition. Some countries can provide more substantial tax rebates, family benefits, housing support and guaranteed income for families with children. With a very low income, this support may outweigh the difference between one and three domestic persons. However, the dependency of contributions to specific rents, age of children and work time means that the results are standardised model casesnot the averages of actual single-users.
Czech Republic in post-transformation comparison
The Czech Republic, Slovakia and Poland have undergone a period of change in ownership structure, industry, social transfers and the institutional framework of minimum wage. But their relative development is not the same: in our selection, the Czech share of the minimum wage in the median in 2025 is approximately 46,9 %, Slovak 51,5 % Polish 59,2 %. It is in addition to these wages that it makes sense to see how many hours a household needs in a model. The GDP statistics per capita alone do not directly determine any such value.
Comparison of data discussed in this section
In all countries, one parent with two children is elected, a legal minimum, a 50% median limit and a model without a rental supplement. The difference therefore captures the coexistence of wages, taxes and transfers.
Source: OECD TaxBEN, DSD _ TAXBEN _ HOURSPOV. The missing figure is not shown as zero.
Chapter 8 · Europe and non-European countries
The same box does not have to mean the same institution
Countries without a national legal minimum wage can protect earnings by collective agreements. Countries with a legal rate differ in coverage, age exceptions and enforcement. The comparison therefore begins with the definition of income and household; only then comes the order of the countries.
The ladder is the final step
International comparisons are often tempting precisely by reducing complexity to order. However, the order makes sense only when the year is defined jointly, household, income, work rates and transfers. Countries can be compared fairly within a specific scenario; one scenario cannot derive from the general quality of the whole social model.
Federal and regional rates countries require special attention. One national minimum wage may be a weak description of the local labour market if housing costs vary dramatically. Similarly, collective minimum-agreed minimum can protect a large proportion of employees without a single legal amount, but protection depends on contract coverage and enforcement.
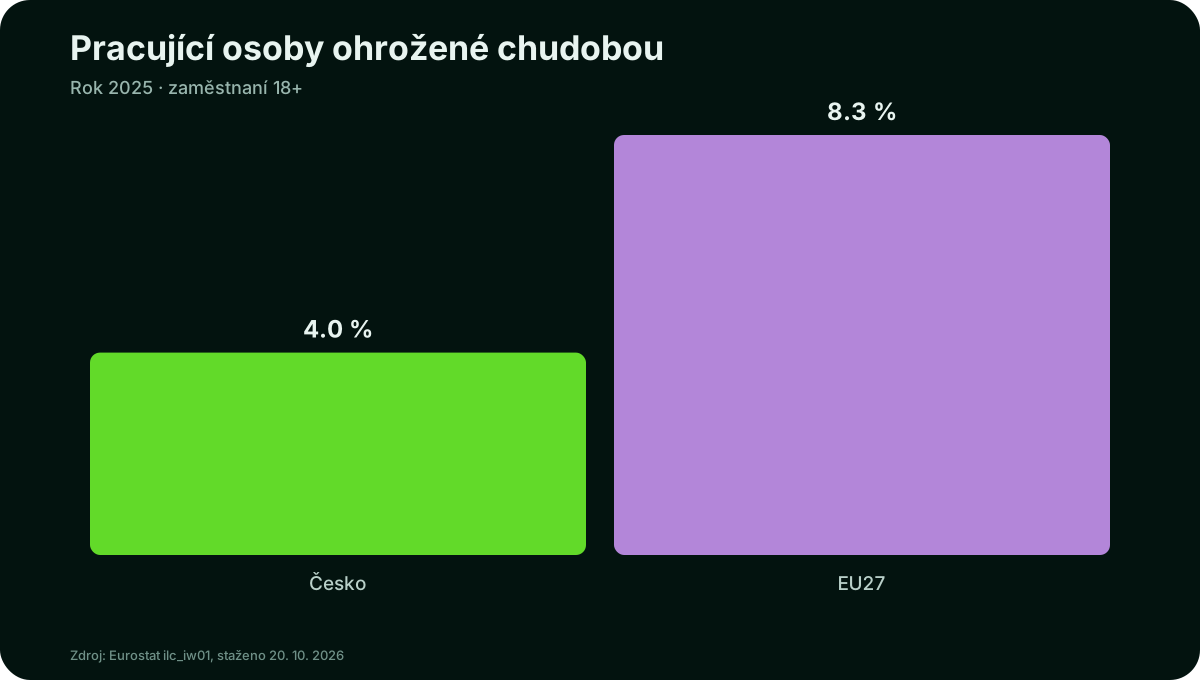
Working alone does not automatically eliminate the risk of poverty
New Eurostat Table Downloaded ilc_iw01 for 2025, for persons employed aged 18 years and more, the level of risk to income poverty 4,0% in the Czech Republic and 8.3% in the EU 27. The Czech Republic therefore relies more favourably on this indicator than the Union's whole, but the non-zero value simultaneously refutes the idea that the status of the employee itself always solves the problem. The result depends on the scope of work, wages and household income.
Comparison outside Europe
The US uses official, more fully designed borders, while the European analytical layer builds on the median share. Japanese, Canadian or Korean data have its own availability and timing. The book therefore maintains national historical series in separate layers and creates a common ranking only where TaxBEN uses a unified model.
One variable, different currencies
Nominal average wages may be converted into currency chosen by the reader at the annual average market rate. Such a comparison corresponds to the financial question of how much would be in the exchange of the year. It does not itself answer the question of standard of living. The purchasing power parity therefore remains a separate analytical layer in international dollars or PPS and is not issued for the CZK, EUR or USD course.
Average annual gross wage in the currency selected
Select the country, year and target currency. The conversion uses an annual average market rate; it does not express local purchasing power.
Select Country
Source: OECD DSD _ EARNINGS @ AV _ AN _ WAGE · World Bank PA.NUS.FCRF · CSV graph data
The unified definition must be preceded by a unified ranking
For European countries, the natural common measure of the 60% median threshold is the equidistant disposable income and the standard household type. The same percentage threshold can be used analytically outside the EU, provided that there are actual comparable data available. National definitions of poverty, based on other percentages or absolute baskets, may remain in separate layers; but they should not be mixed in a single order of outcome without recalculation.
Eurostat contains the historical database of poverty thresholds since 1995 and minimum wages since 1999. However, it includes different coverage times by country, breaks in series and countries without a national minimum. When comparing nominal wages and income limits, both amounts must be expressed in the same currency and in the same year. More importantly, the difference between rough minimum wage; and clean income needed to cross the border: without local calculation of taxes and levies, the percentage or number of hours cannot be declared as a measured result.
The international time comparison is only meaningful after verification of the methodology of both parties to the calculation. In the overview, we therefore separate the observed official values from the modeled hours and do not introduce an incomplete "European ranking" created by simply dividing gross wages by the net income threshold.
At the same time, countries such as Denmark, Sweden and Austria are not a common case of national statutory minimum wage. The absence of data in the Eurostat database does not automatically mean that people work without wage protection; collective agreements can play a significant role. In such cases, a representative contract tariff or other transparent defined income scenario should be identified.
Comparison of data discussed in this section
Average annual gross wages are converted at a market rate to USD. It is a nominal currency comparison; it does not express local purchasing power or wage distribution.
Source: OECD Annual Average Wages · World Bank PA.NUS.FCRF. The missing figure is not shown as zero.
Chapter 9 · What to afford: living, car, cottage and holiday
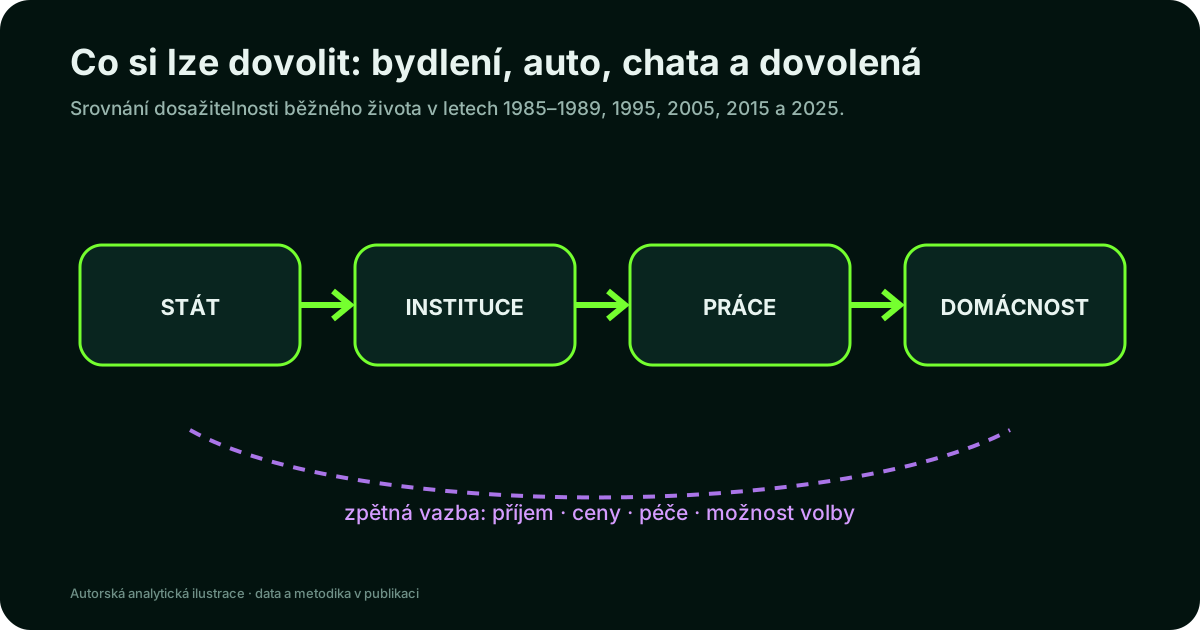
Housing is where abstract income turns into restrictions
Two households with the same disposable income may have a completely different choice area according to their rental relationship, region and energy performance. That's why we're looking at excessive housing load next to the income line. This indicator does not say the price of the apartment; it says how many people will be cost-taking a large part of the disposable income.
Achievement is not the same as ownership
The question of "what a man could afford" needs at least four denominators. The first is the price in times the average or median wage. The second is the part of income that can actually be deferred after basic expenditure. The third is the availability of credit and the size of the repayment. The fourth is a non-monetary obstacle: waiting list, allocation, material shortage, self-help or today's high entry price. The ownership share merely shows the outcome of past decisions, heritage and policies; it is not itself a price tag for a new buyer.
Five time points, two types of household
The comparison therefore leads to two parallel profiles: a household around a national median and a low-income household. The years 1980-1989 form an institutionally different base; 1995, 2005, 2015 and 2025 follow the gradual emergence of today's price, mortgage and market lease systems. The missing historical price of the cottage or comparable house will not be replaced by the impression. The table will remain an open location with a designated source to track.
| Period | What can be documented | What does a number not say |
|---|---|---|
| 1985–1989 | The new Skoda 120 L cost about 21,2 gross wages in 1988. The housing account for 7.4% of the expenses of the worker's household in 1989. The 1991 inventory registered 396 427 recreational buildings, 10.7 per 100 residential homes. | He does not appreciate waiting list, self-help, lack of material, family work or whether the cottage was inherited, adapted or newly purchased. |
| 1995 | The average gross wage of CZK 8 172 is the reference denominator. Comparable asset prices still require a period table. | Without the price of the same type of house, cottages and cars, one ratio of availability cannot be created honestly. |
| 2005 | Cost of a new apartment in a family house 2,7425 miles. CZK was about 149.5 of the average gross wage at the time. | This is a new construction, not the average price of all houses or the necessary cash without a mortgage. |
| 2015 | 32.4% of people said that the household cannot afford a week off. | The indicator does not measure the quality or the target of the holiday and does not determine whether the household has actually left. |
| 2025 | The average price of the family house was 56 066 CZK / m ². The week of vacation could not afford 19.0% of people, but 55.7% of people below the income threshold. | The national average of the house price is not the price of a particular property and must not be mixed with the regional rankings. |
Working data matrix: Download CSV. Historical gaps are deliberately visible.
Fountains: CSU: Mr. Average Buys · CSU: history of family accounts · Addition of recreational objects 1991 · ČSU: prices of real estate 2023-2025.
Vacation as a direct test of the budget area
Eurostat does not ask whether people actually went on vacation, but whether their household can afford one week away from home. This captures the financial possibility even if the family does not want to travel. In the Czech Republic, the proportion of persons without this option decreased from 40.6% in 2005 to 32.4% in 2015 and 19.0% in 2025. However, in persons below the 60% median limit, it remained at 55,7% in 2025. This supports the user's low income intuition, but simultaneously refutes the claims of a flat deterioration for the whole population between 2005 and 2025.
Who can't afford a week's vacation
Select the entire population or group above / below the 60% median limit and go through years.
Source: Eurostat lic _ mdes02 · CSV graph data
The price index does not have a family budget unit
The HICP shows how the price of a representative consumer basket changes. The index value does not tell how much CZK the family needs and does not automatically compare the price level of two countries. Moreover, households consume different baskets: a low-income family emits a larger share of housing, energy and food, so that the same overall inflation may have a different effect on it.
Housing differs from other expenditure by low short-term adaptability. The tenant cannot easily change the apartment every month and the mortgage owner carries interest and repair risk. The issue therefore creates long commitments and regional lockouts. The availability of work without available transport and housing can only be formal.
Receipt and property are two different axes of life security
A low-income household can own paid-up housing, while a higher-wage household can pay most of the free money to rent or mortgage. The same income does not therefore mean the same ability to absorb the blackout. The value and liquidity of the assets, the amount of liabilities, the interest rate terms and whether the asset can be used without any loss of home is determined.
The historical comparison must separate the entry price from the ownership share. The high proportion of the ownership may be the result of earlier construction, privatisation of the housing fund and the inheritance. It does not say whether the same farm can be acquired today by a young household from a normal work income. The full model therefore also needs household balance sheets, alongside income: financial reserves, real estate, mortgages and other debts.
What the budget model captures and what it does not
The model links income after taxes and levies with household costs according to its composition, legal relationship to housing and age of children. Therefore, the national comparison does not show differences between cities or prices of specific flats. The household expenditure observed should be read in addition to the normative minimum: low spending may reflect austerity, but also forced restrictions on heating, food, recreation or health care.
Poverty by income and the cost of everyday life are not the same
The income line of poverty says where the household stands against other incomes in its country. However, it speaks only indirectly about how hard it is to pay her rent, energy or food. There is another way to a real life budget: from earnings through taxes and benefits to prices and real household spending.
In 2025, according to Eurostat in the Czech Republic, the excessive burden of housing costs was faced 8.2% of population; in the income group below 60% median it was 43,4 %. For persons above that limit, the proportion of the 4,5 %. The indicator considers housing to be an excessive burden if its costs exceed 40% of the household's disposable income (according to Eurostat methodology). This is not about the amount paid for the flat or the percentage of all poor households: it is about the proportion of people living in such households.
How prices were changing · Eurostat HICP, 2025 = 100
The consumer price index allows to monitor the change in time within each country. The value of 100 in 2025 does not mean that prices are the same in all countries. Each country has its own price level and the index expresses its time evolution.
The annual average HICP index, ECOICOP version 2; for the year and item concerned it is the index, not the percentage change, and certainly not the price of the basket in crowns or euros. Selected historical series do not start everywhere in 1996.
How many people live in households with excessive housing costs?
The difference between the population below and above the income threshold illustrates why it cannot be argued that the statistical threshold is exceeded by the available housing alone. This is a separate social indicator, not a conversion of the price index.
Share of persons (%), Eurostat ilc_lvho07a, total age, gender total; groups below / above 60% median of the IDS. For some countries and years, the original data may show a break in a series, estimation or revision.
| Indicator | Selected year |
|---|
Fountains: Eurostat - harmonised prices and Eurostat - excessive burden on living by poverty. Local copies of the data actually downloaded are included in this article in: data/rev5c/.
Both rows are a complement to comparing the hours needed. Inflation expresses a change in the price of the consumer basket; the housing indicator shows how many people are actually exposed to a strong cost-to-income ratio. Neither alone determines how many hours a single person or family with two children must work to pay for it. specific the budget required. This requires data in national currency on expenditure of each type of household and corresponding net income after levies and levies.
Comparison of data discussed in this section
Index 2025 = 100 shows the cumulative price evolution of the individual groups. The comparison of countries does not tell us where the price level is higher; it shows how quickly the group has changed compared to its own year 2025.
Source: Eurostat HICP, annual average, recalculated 2025 = 100. The missing figure is not shown as zero.
Chapter 10 · Who collects productivity
Productivity is not automatically translated into wages
Higher productivity creates room for wages, investment, profit and public revenue. The division between these channels is the result of ownership, market power, collective bargaining and tax rules. The same output growth can therefore bring higher wages, more stable work, better public service, or almost nothing from the above.

The value string divides both control and yield
The production plant can be highly productive and at the same time have little power over the product, price and disposal. Development, brand, financing and distribution networks may remain in another country. The worker's salary therefore depends not only on his physical performance but on the position of the undertaking in the chain and on who controls intangible assets.
Foreign ownership is not in itself evidence of loss and domestic ownership is not a guarantee of fair distribution. The alternatives are important: can a company change customers, can a worker change employers, can the State negotiate tax rules and develop domestic developments? The suverenity again manifests itself here as a number of real possibilities, not as the origin of the owner's passport.
Collective negotiation as one of the transmission institutions
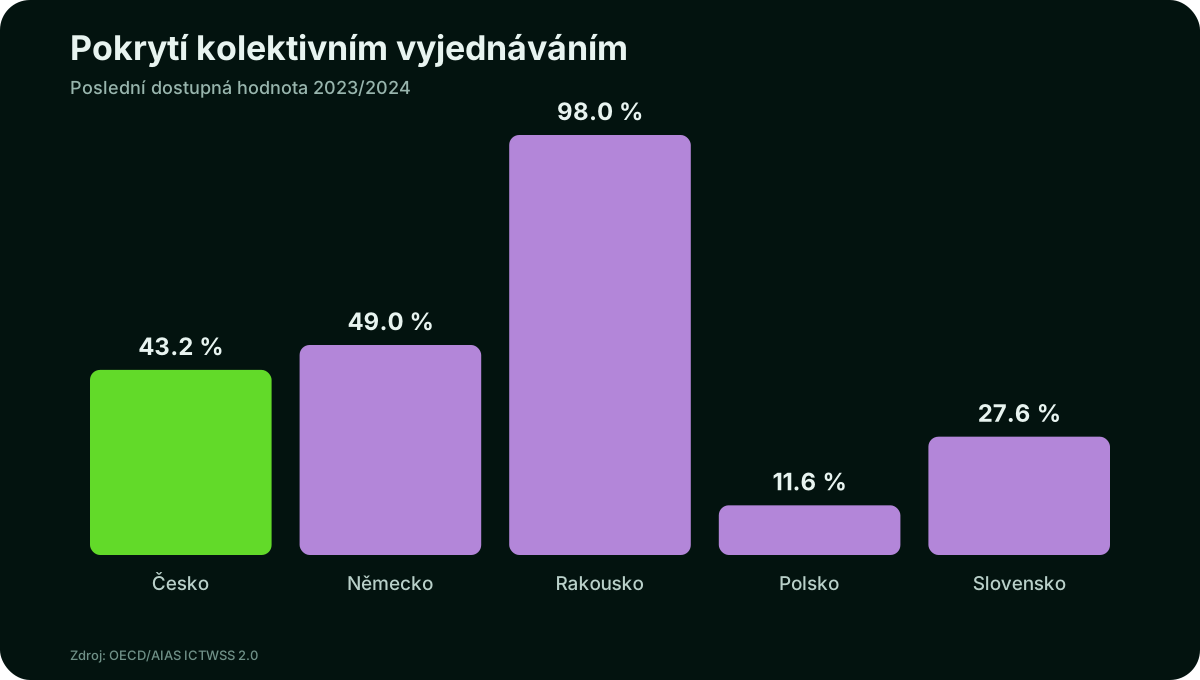
The OECD / AIAS ICTWSS database estimates coverage for 2024 by collective bargaining 43.2% of Czech employees49% in Germany and 98% in Austria. The Polish last available value is 11,6% in 2023 and 27,6% in 2024, with a different observation status for the Slovak value. The difference does not explain wages itself, but shows that countries are transferring productivity into working conditions through various broad negotiating institutions.
Covering the contract is not the same as membership of trade unions and high coverage is not an automatic guarantee of high wages. For our argument, it is a middle mechanism: apart from the minimum wage and labour market, it affects how many employees negotiate the terms and conditions together and how many individually.
Unit-to-unit purchasing power: power and consumption are not the same
To link the macro-economy to the standard of living, we add two series of Eurostat in purchasing power parity. In 2025 it reached Czech GDP per capita 92% of the EU27 average, while actual individual consumption per capita (AIC) 83%. AIC includes goods and services that people actually consume, whether they are covered by the household, the State or a non-profit institution. It is therefore closer to GDP for material welfare, but it is still the average and not the income of the median household.
The difference between nine index points cannot be automatically attributed to a single cause. It is influenced by the structure of the economy, investment, foreign income, publicly provided services and the way of measurement. It is an indicative bridge between productivity and consumption, not a new global verdict. Only together with the median, income poverty and housing does the country's performance reflect into normal life.
Who bears the drop
With weaker demand, the company can reduce margins, investments, working hours, employment or wages. The decision divides the risk between capital, work and public budget. Short-term employment support can prevent skills loss, but long-term maintenance of a non-prospective structure can delay the necessary change. Therefore, the assessment must distinguish the temporary shock from the permanent decline.
Who collects the benefits of growth and who carries the risk of slowing it down?
International economic relations are not just flows of grants and loans. There are also ownership relationships, sales dependencies, know-how, capital and labour income. A country may have low public debt, while having a significant share of its production under foreign ownership control. On the contrary, it may have higher debt, but strong domestic productive capacity and enough alternative trading partners. The indicator of the hours needed to overcome poverty adds a human and family dimension to this picture.
The export success of the Czech automotive and engineering industries has increased the performance of the economy and created jobs. At the same time, he opened up questions about what part of the value added remains in wages, how the remuneration in domestic and foreign firms differs, what part of the profit the owner reinvests and how strongly the income depends on the decision of the foreign customer. However, the result on the payroll and the achievable family support is the main decision for households working for the minimum.
It is therefore appropriate to read this article together with the book Assistance, debt and sovereignty. This analyses the long-term history of international economic links and transformations. Here we are looking at the same question from below: what place is a specific working person and his children in the distribution structure. Economic sovereignty from a family perspective is not exhausted by the state balance; it also includes the real possibility of refusing to work at a disadvantage, of dividing up child care and not being existentially dependent on an impossible working week.
The ultimate goal of the economy is not to minimize the graphic column at all costs. The "clock to poverty" ladder does not in itself affect the quality of public services, housing, health care, safety and leisure time. However, it provides a useful and controllable benchmark for the first step: how does society cope with a situation in which one or two adults earn low or typical pay and live children.
Comparison of data discussed in this section
Choose two countries and follow the share of employees covered by the collective agreement. The indicator is not identical to trade union membership or salary; it captures the scope of one transfer institution.
Source: OECD / AIAS ICTWSS, Collective bargain cover. The missing figure is not shown as zero.
Chapter 11 · Social State, work and resilience
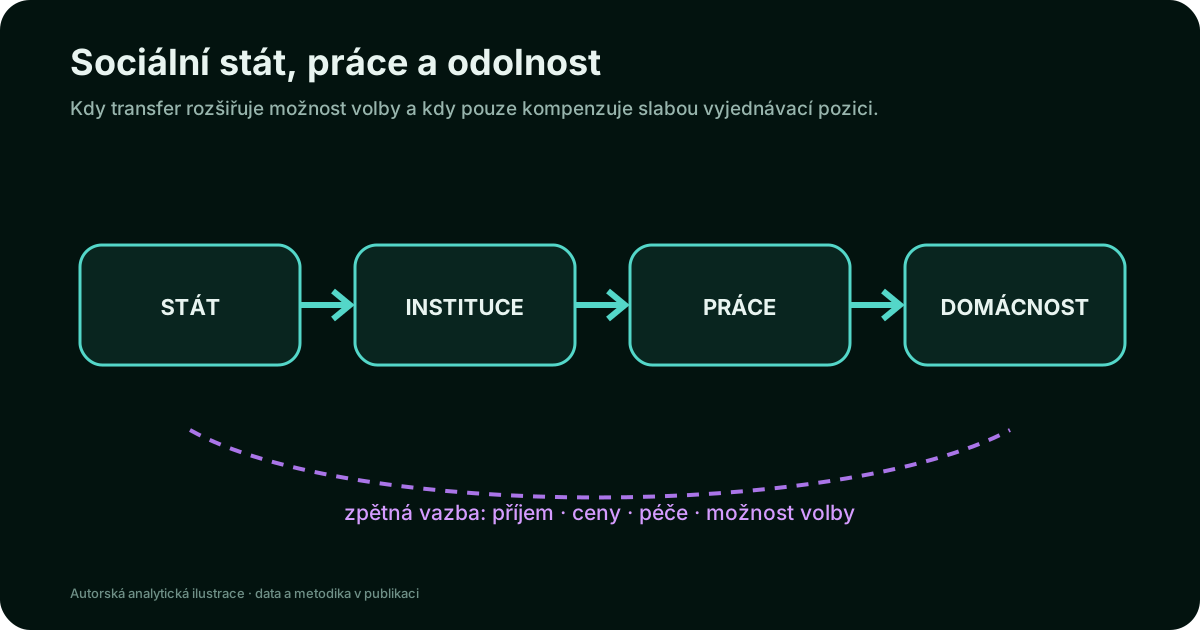
The welfare state is not the opposite of work
The tax rebate, family benefit or housing promotion may reduce the number of hours needed to cross the income threshold. It does not imply that the dose replaces the wage without consequences. If the system has long-term subsidies for very low remuneration, it transfers part of the cost of work from the company to the public budget. On the contrary, if it allows care, education or transition between jobs, it can strengthen the bargaining position of the worker and productivity.
Resistance means the possibility to absorb shock without disintegration of the household
Macroeconomic resilience is often measured by the national reserves, debt and stability of banks. From the household's point of view, it includes savings, affordable housing, income insurance, public health and the possibility of temporarily reducing work without losing essential needs. These two levels are complementary: a state without fiscal space helps hard, a household without reserves transfers even a short shock to debt or loss of housing.
TaxBEN results in this sense are one test of institutional resistance. It shows the point where modelled work and support will take the household above the relative limit. It does not say how far away the household is from material scarcity, whether it has a provision for failure of the appliance or how much time is left to care.
Risk insurance and investment in competences
Social policy has at least two functions. The first insurance against a failure of income, illness, unemployment or birth of a child. The second invests in skills through education, health, care and available mobility. In the first case, it protects consumption during shock; in the second it expands future possibilities. Both functions may increase the willingness of a person to change their work or supplement their qualifications.
The method of financing is part of the result. The general budget-paid levy, the insurance benefit linked to the previous income and the service provided directly by households have different distribution effects. The same nominal value of the aid also means something else in the region with available housing and in the city where the rent absorbs most of the income.
The well-designed support maintains a smooth transition
If the dose disappears at a single point, additional work may increase gross income and at the same time not change the income available. The so-called effective marginal burden is therefore more important than the tax rate itself. Continuous cutting, available care and clear rules limit the situation where the household reasonably refuses more work because it would not help it after costs.
At the same time, the resistance cannot be built only by transfers. It needs jobs, productive companies, enforceable law and public services. When a productive base is missing, social spending comes across funding. When there is no protection network, every economic shock destroys human capital, consumption and trust. The dispute between performance and protection is therefore often a dispute over the time horizon that is badly described.
Debt bursts the household through the budget, not the personal deposit
Interest paid to creditors is the actual expenditure of the State budget. They may reduce the scope for services, investments or transfers, but there is no automatic rule that each crown of interest means the same crown taken from a particular levy. The distribution of the impact is a political decision: the State can adjust taxes, other expenditure, investments, reserves or new financing. That's why we're tracking the service load separately from the principal itself.
Government debt management costs 1993-2025
Interest expenses are shown separately from total costs, which also include fees.
Source: Ministry of Finance: Net government debt management expenditure · CSV graph data
The financing needs are not the same as the annual deficit
The State does not only finance the new balance of the budget in a given year. It also has to pay or refinance bonds and other instruments previously issued. The total funding needs therefore include the primary balance, the cost of the debt service, the principal payable and other financial operations. The repayment of the old bond is neither a new public service nor a new deficit, but the State must have cash or access to new financing at the time of maturity.
This creates a direct link with the first book: sovereignty is not only determined by the debt-to-product ratio, but also by the maturity profile, investor confidence, currency, interest and existence of alternative sources. A high need for refinancing in an unfavourable year may be more expensive for operators without an equally large new primary deficit.
Funding needs and its selected components 2008-2025
The lines have the same unit but are not simply a breakdown of the whole: the need for funding also includes the principal and other financial operations to be paid.
Source: Ministry of Finance: Need and sources of funding · CSV graph data
Public service is part of the standard of living, even if it does not come into account
Two households with the same income may have different living standards according to the availability of health care, schools, childcare, public transport and social housing. When the service is reduced, the need also does not disappear: the household can buy it privately, replace or give up unpaid care. The state's budget savings can thus be moved to household money and time.
Unpaid care is a particularly important transmission layer. Income statistics do not appreciate it as a wage, but they limit the number of hours paid and often divide unevenly among household members. The economic sovereignty test must therefore also monitor the time burden and availability of services that can reduce it, in addition to net income.
High health expenditure is not evidence of available care
The United States is a significant example of the difference between money flowing through the system and household result. The OECD reports spending USD 14.885 per purchasing power parity per capita, more than twice the OECD average of USD 5 967. However, the coverage of the core service package is reported by the OECD for 93% of the population, not for all, while at the same time the US lacks a fully comparable figure on financial coverage and the unfulfilled need for care. US CMS for 2024 accounts for USD 15 474 per person and 18% of GDP, with households' direct spending reaching USD 556.6 billion.
The total expenditure may increase due to higher performance and drug prices, administration, care intensity or higher service levels. Neither of these components itself guarantees that a particular person will receive an operation without complicity, debt or delay. The American CDC therefore also monitors the care deferred for the price next to the insurance. For comparison of systems, we need at least five separate variables: per capita expenditure, price level, insurance coverage, household participation and unfulfilled needs.
The difference is also seen with medicines. The Canadian PMPRB regulator found that US price list prices for comparable patented drugs were on average 264% higher than Canadian in 2024. This is the weighted price list of the same medicines selected, not the universal ratio of each product or the final amount after discounts and insurance. Yet they show, in an illustration, why higher spending may not mean more affordable care.
Fountains: OECD: Health at a Glance 2025 - United States · CMS: National Health Expenditure Fact Sheet · CDC: Health Insurance and Healthcare Costs · PMPRB: Annual Report 2024.
Expenditure, participation and coverage in 53 countries monitored
The international comparison therefore does not bring countries together in a single European or non-European model. For each country, the expenditure per capita in purchasing power parity, the share of direct payments by households and the coverage index shall be separated by basic services. The time overlap allows two countries to choose and watch several variables simultaneously. The index mode compares the rate of change; after the start and in detail the absolute values and their units remain.
The share of the payments from the pocket must be read together with their absolute amount and insurance rules. The low percentage may also be due to the fact that the total expenditure of the system is extremely high; moreover, it may not be necessary to capture premiums paid by households or employers. The coverage index summarises the availability of selected basic services, but does not indicate the price of a specific operation, waiting time or quality of each performance.
Health system: expenditure, direct payments and coverage
Select two countries and compare developments. The curves are indexed to the selected common year; absolute values remain below the graph in detail.
Overview of all 53 countries monitored - last year available together
| Country | Year | Discharge per capita (PPP int. $) | Direct payments from the pocket | Service coverage (0-100) |
|---|---|---|---|---|
| Albania | 2023 | 1 465 | 48.3 % | 71 |
| Armenia | 2023 | 2 033 | 80.5 % | 69 |
| Australia | 2023 | 7 691 | 15.8 % | 89 |
| Belgium | 2023 | 7 489 | 21.5 % | 86 |
| Bosnia and Herzegovina | 2023 | 1 989 | 31.0 % | 64 |
| Bulgaria | 2023 | 2 970 | 35.5 % | 73 |
| Belarus | 2023 | 2 193 | 28.5 % | 80 |
| Chile | 2023 | 3 337 | 34.6 % | 84 |
| Croatia | 2023 | 3 229 | 9.4 % | 76 |
| Denmark | 2023 | 7 098 | 14.0 % | 85 |
| Estonia | 2023 | 3 507 | 22.1 % | 79 |
| Finland | 2023 | 6 433 | 14.1 % | 86 |
| France | 2023 | 6 719 | 9.3 % | 82 |
| Georgia | 2023 | 1 679 | 58.8 % | 71 |
| Ireland | 2023 | 8 269 | 11.3 % | 82 |
| Iceland | 2023 | 6 618 | 14.7 % | 90 |
| Italy | 2023 | 4 866 | 23.6 % | 82 |
| Israel | 2023 | 4 033 | 20.5 % | 85 |
| Japan | 2023 | 5 365 | 12.2 % | 86 |
| South Korea | 2023 | 4 798 | 31.8 % | 88 |
| Canada | 2023 | 7 355 | 15.2 % | 92 |
| Kazakhstan | 2023 | 1 460 | 27.6 % | 83 |
| Cyprus | 2023 | 4 538 | 17.9 % | 76 |
| Lithuania | 2023 | 3 819 | 31.0 % | 78 |
| Latvia | 2023 | 3 034 | 35.1 % | 77 |
| Luxembourg | 2023 | 8 329 | 8.8 % | 83 |
| Malta | 2023 | 5 706 | 30.9 % | 82 |
| Hungary | 2023 | 2 875 | 23.1 % | 80 |
| Moldova | 2023 | 1 181 | 27.5 % | 71 |
| Netherlands | 2023 | 7 727 | 12.0 % | 85 |
| Norway | 2023 | 9 523 | 13.7 % | 89 |
| New Zealand | 2023 | 5 531 | 12.6 % | 89 |
| Germany | 2023 | 8 306 | 11.1 % | 87 |
| Poland | 2023 | 3 332 | 15.8 % | 82 |
| Portugal | 2023 | 4 679 | 29.3 % | 83 |
| Austria | 2023 | 7 884 | 16.5 % | 84 |
| Romania | 2023 | 2 614 | 23.0 % | 77 |
| Russia | 2023 | 3 204 | 28.4 % | 81 |
| Northern Macedonia | 2023 | 1 808 | 39.6 % | 69 |
| Slovakia | 2023 | 3 230 | 20.2 % | 78 |
| Slovenia | 2023 | 4 949 | 12.4 % | 84 |
| Serbia | 2023 | 2 303 | 32.1 % | 73 |
| Turkey | 2023 | 1 769 | 19.0 % | 77 |
| USA | 2023 | 13 473 | 10.9 % | 88 |
| Ukraine | 2021 | 1 382 | 45.3 % | 79 |
| United Kingdom | 2023 | 6 365 | 14.6 % | 88 |
| Azerbaijan | 2023 | 993 | 64.6 % | 67 |
| Montenegro | 2023 | 2 908 | 26.3 % | 70 |
| Czech Republic | 2023 | 4 500 | 14.6 % | 83 |
| Greece | 2023 | 3 454 | 34.3 % | 77 |
| Spain | 2023 | 4 935 | 20.9 % | 84 |
| Sweden | 2023 | 7 512 | 13.0 % | 85 |
| Switzerland | 2023 | 10 602 | 22.0 % | 87 |
Source: WHO Global Health Expenditure Database via World Bank WDI; WHO Global Health Observatory. · CSV graph data
Three ways to compare states
One table answers only one question. The following three column views therefore work with the same data, but change the way of comparison. The first holds a solid year and shows several indicators for two states. The other holds one indicator and compares two countries in the entire time series. The third will leave the reference state and the other rider will gradually pass through all 53 countries.
How to read column height: each indicator has its own scale and its own unit. The issue in international dollars, the percentage of direct payments and the coverage index are therefore not drawn on one common axis. There are always two states within the same indicator.
Commercial is an institutional scale, not a continent-to-continent border.
The hypothesis that health services operate more as a business model than as a social system can be tested according to specific rules: whether access is separated from employment and income, how much insurance risk is shared, who negotiates prices, what are the participation, whether the provider can refuse care and how strong the incentive is to generate profits from the volume and price of performance. Market economies can stand very far apart on this scale.
Europe is therefore not a single model and the non-European countries are not the opposite of it. The tax-financed service, social health insurance, regulated compulsory private insurance and, in the majority, the private model create various combinations of availability, waiting, price and choice. The purpose of the chart is not to declare a winner by one amount, but to show which institutional arrangements transfer money to widely available care and financial protection of households.
Chapter 12 · Suverness measured from the household
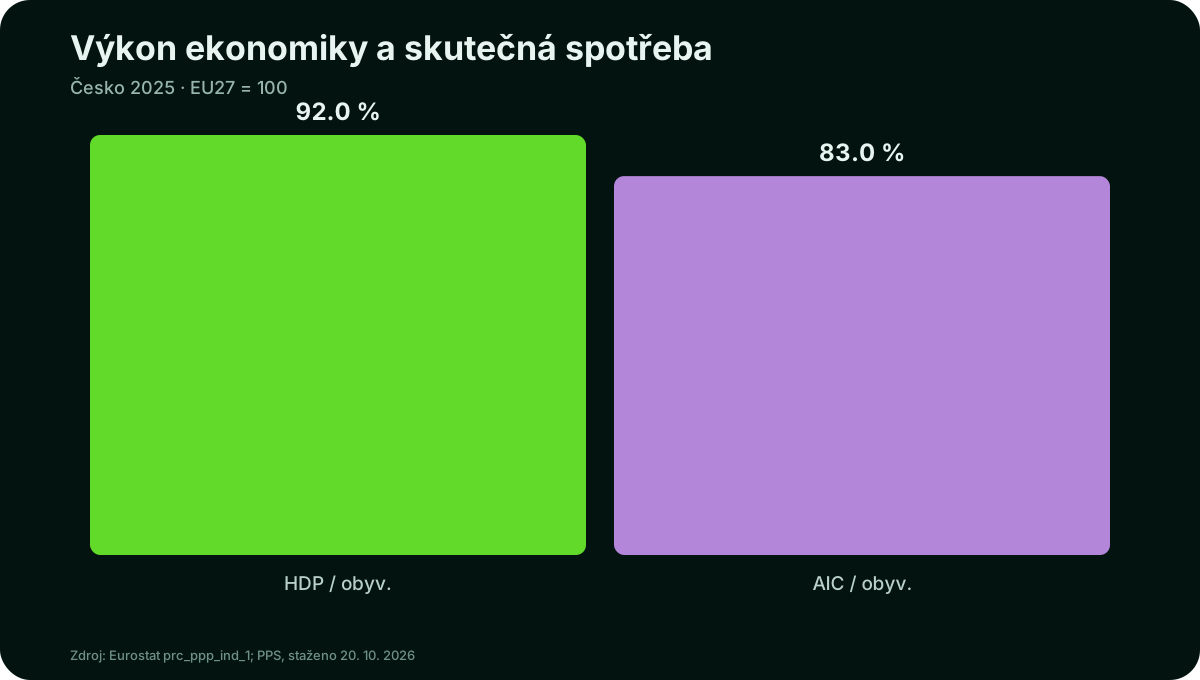
Double sovereignty
The first book showed sovereignty as a structure of state options: the ability to finance decisions, to change partners, to carry short-term cargo and to refuse parole. The same definition can be applied to the household. Its economic sovereignty is growing when it has more than one real job option, public services available, a reserve and income that is not entirely absorbed by the basic costs.
State and domestic sovereignty may be disintegrating. Low public debt does not exclude high private debt, expensive housing or low wage bargaining power. Strong social protection, in turn, needs a productive base and sustainable funding in the long term. Therefore, the conclusion is not the only order of countries, but a set of interconnected tests.
Four tests of economic sovereignty from below
Receipt test asks whether the standard working week creates available income above the chosen household-specific limit. Cost test examine whether housing and basic expenditure will not absorb the result. Time test See if work leaves room for care, health and civic life. Shock test See if a short outage leads to debt, loss of housing or a breakdown of long-term options.
These tests are not the only new index. They are to prevent a good result in one dimension from hiding a failure in another. The household can be income above the border but overloaded; it can have cheap housing, but very precarious work; it can have high wages, but it can have a zero reserve with high debt.
How both books control each other
Assistance, debt and sovereignty warns against reading debt as a moral score. This publication warns, mutatis mutandis, against the reading of wages as a full standard of living score. In both cases, the structure of the relationship, the allocation of risk and the possibility to refuse the condition shall be decided. The state needs alternative financing and business partners; the household needs alternative employment, services and a reserve.
The follow-up research will therefore not seek one amount to close the debate. It will specify mechanisms between productivity and household: wage distribution, taxes and transfers, housing costs, unpaid care and ownership. Any extension shall maintain reproducibility and distinction between observation, model and interpretation.
Four transmission channels between the State and the household
Budget channel transfers taxes, interest and spending priorities to transfers and services. Price and credit channel operates through inflation, interest, rent and availability of funding. Working and Investment Channel changes demand for work, productivity and negotiating position. Time Channel decide whether care is provided by a paid service, a public institution or, without a salary, the household takes over.
These channels explain why the same macroeconomic indicator does not always lead to the same result. Fiscal consolidation may reduce the risk premium but also weaken services or demand; an investment financed by debt may increase future capacity or create a cost without adequate benefit. The evaluation must therefore not only determine the amount and year, but also the beneficiary, the financing method and the transmission mechanism.
Data bridge for the first publication
We only take indicators from the first book to help explain the transfer from state to household: real product per capita in purchasing power parity, share of industry and manufacturing industry, remittance, central government debt and debt service in relation to export. It's not a new ranking. Each indicator corresponds to a different question: the product measures capacity, the production structure of the source of jobs, the remittance of household income dependence from abroad and the debt service pressure on foreign exchange income.
Coverage is not the same for all countries. The central government debt cannot be confused with the debt of the entire general government sector without designation, and the foreign debt also includes private debtors, according to the indicator. Therefore, the series are taken over with the original unit, source and note and gaps remain visible.
Where are the numbers and what can be derived from them
The historical chart of OECD 2013 is a reconstruction of the published model result. Czech historical tables of gross wages and statutory minima are based on the time reports of CSU, MPSV and for some of the older values from their secondary production. The poverty threshold 2018-2025 comes from the Czech EU-SILC survey; for households with children it is derived by the above mentioned validation scale. The 2025 earnings calculator uses publicly described wage taxation, not OECD TaxBEN microdataset.
We therefore distinguish three types of data: direct statistical observations, transparent derived numbers and model estimates. The combination of different sources can bring methodological differences, for example between the time of the inquiry and the year of reference revenue. The assumption of two children under 14 years of age is deliberately constant; equivalent weights must be recalculated when changing the age of children. Historical international data starts in different years, and therefore the empty spaces are not interpolated.
The public statistics used, the original OECD publications and their bibliographic references are listed above. The calculations of households have the same year, scope, income definition and type of derivation. Download Czech poverty limits by type of household (CSV).
Comparison of data discussed in this section
Select the states, year and indicator taken from the first book. Each indicator remains in its own definition and unit; the graph does not create a cumulative order of countries.
Source: World Bank WDI; selected reproducible layer of the first publication. The missing figure is not shown as zero.